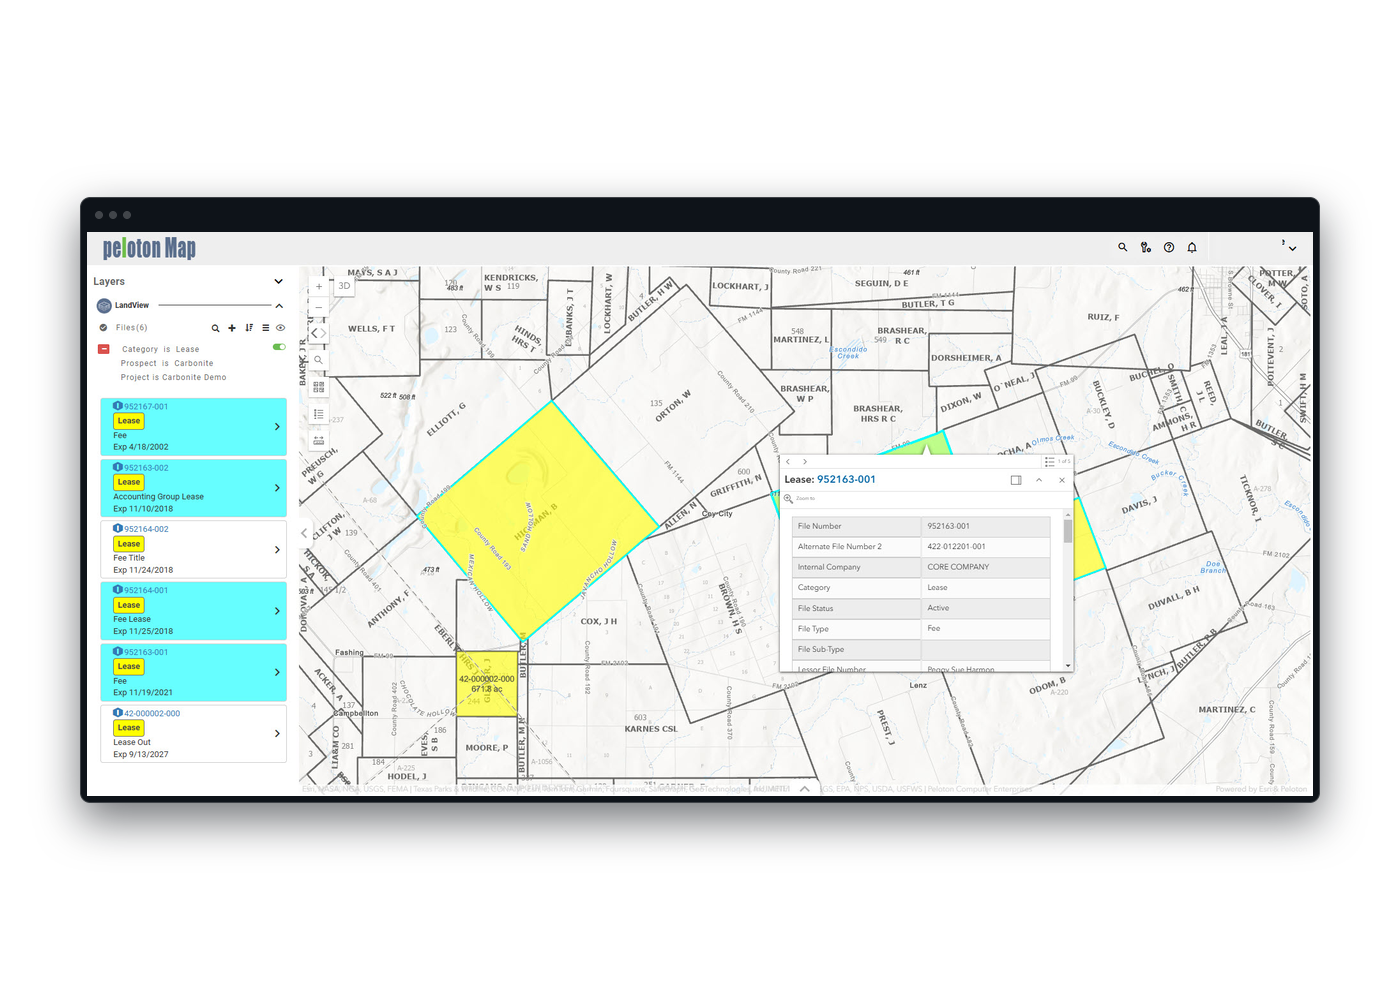
Platform Integration, Built-In
Out-of-the-box mapping is available starting with LandView, with built-in links across applications for a connected experience.
Spatial context helps the team ask better operational questions.
Seamlessly integrated with LandView to display your agreements, wells, and facilities with live, bi-directional interactivity. Easily map stakeholders and crossings, and generate dynamic line lists for complete operational context.
Operating Context: See the location, nearby assets, and relevant layers around an agreement.
Files, Facilities and Wells: Panels list files by category, obligation, year or shape accuracy, beside business associates, facilities and wells.
Your Own Layers: Bring in your own layers and imports beside Peloton records.
User-Customized Views: Save areas of interest, control map layers, and build workflows around your data.
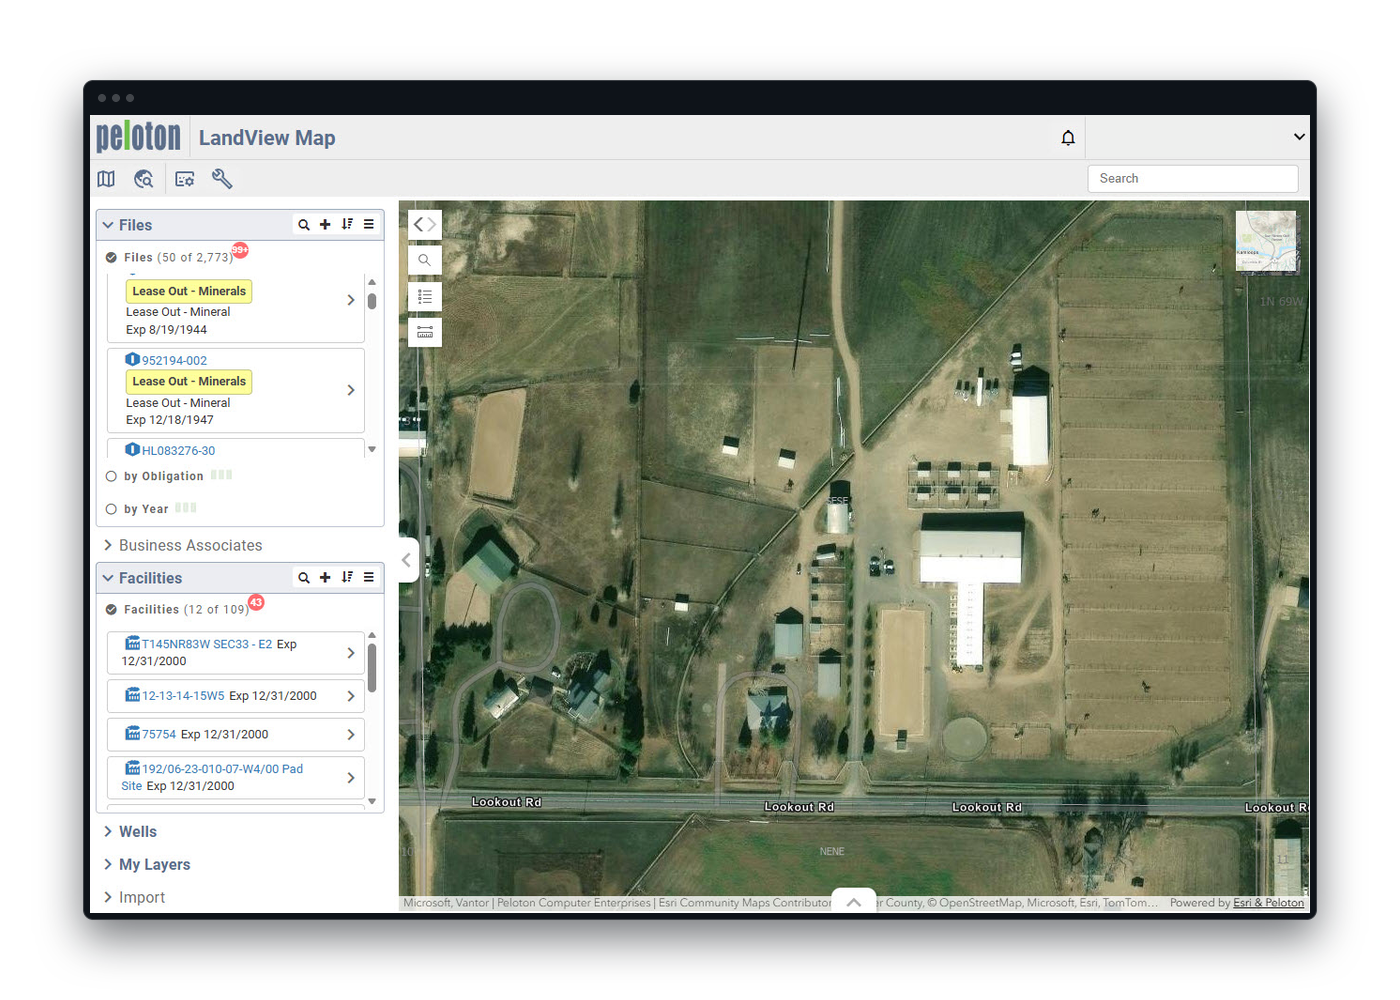
Say goodbye to manual updates. As records change in LandView, LandView Map updates automatically, improving accuracy.
Maps from Legal Descriptions: Legal descriptions entered in LandView automatically generate maps—no manual GIS work needed.
Stakeholder Addresses: The same applies to address-based stakeholder visualization.
Out of the Box: Out-of-the-box mapping is available starting with LandView.
Shapes from Broker: Shapes created in Peloton Broker carry through to LandView, with no re-digitizing.
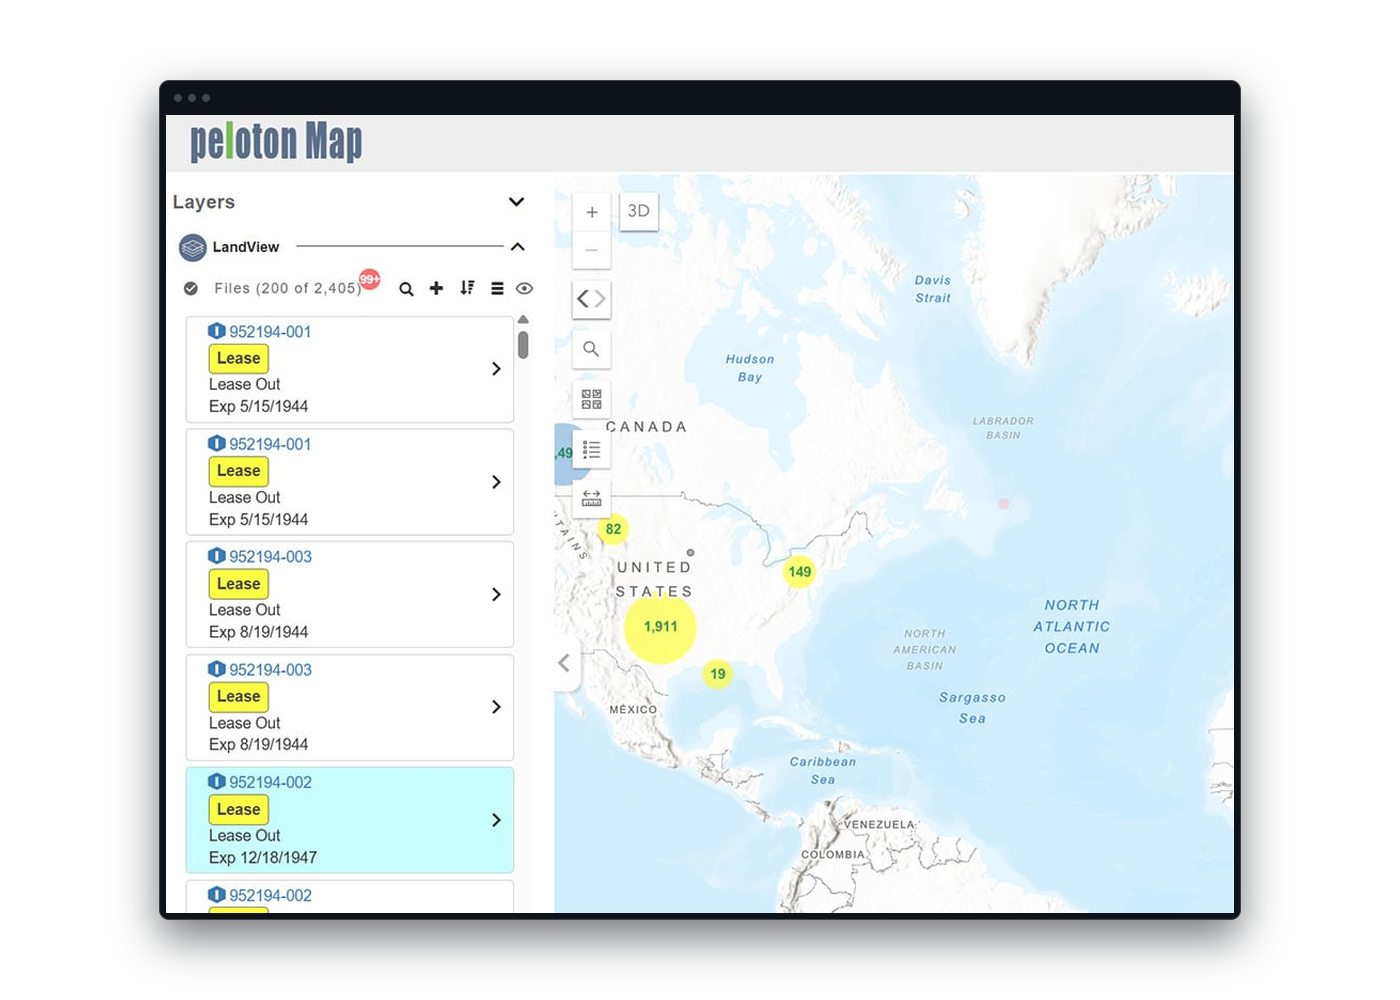
Drill into details with info cards, data pop-ups, or the tabular view for quick access within the map. Hyperlink directly to LandView agreements for complete, detailed information.
Peloton Platform Integration: Navigate between LandView Map, LandView, WellView, SiteView, and ProdView with linked records.
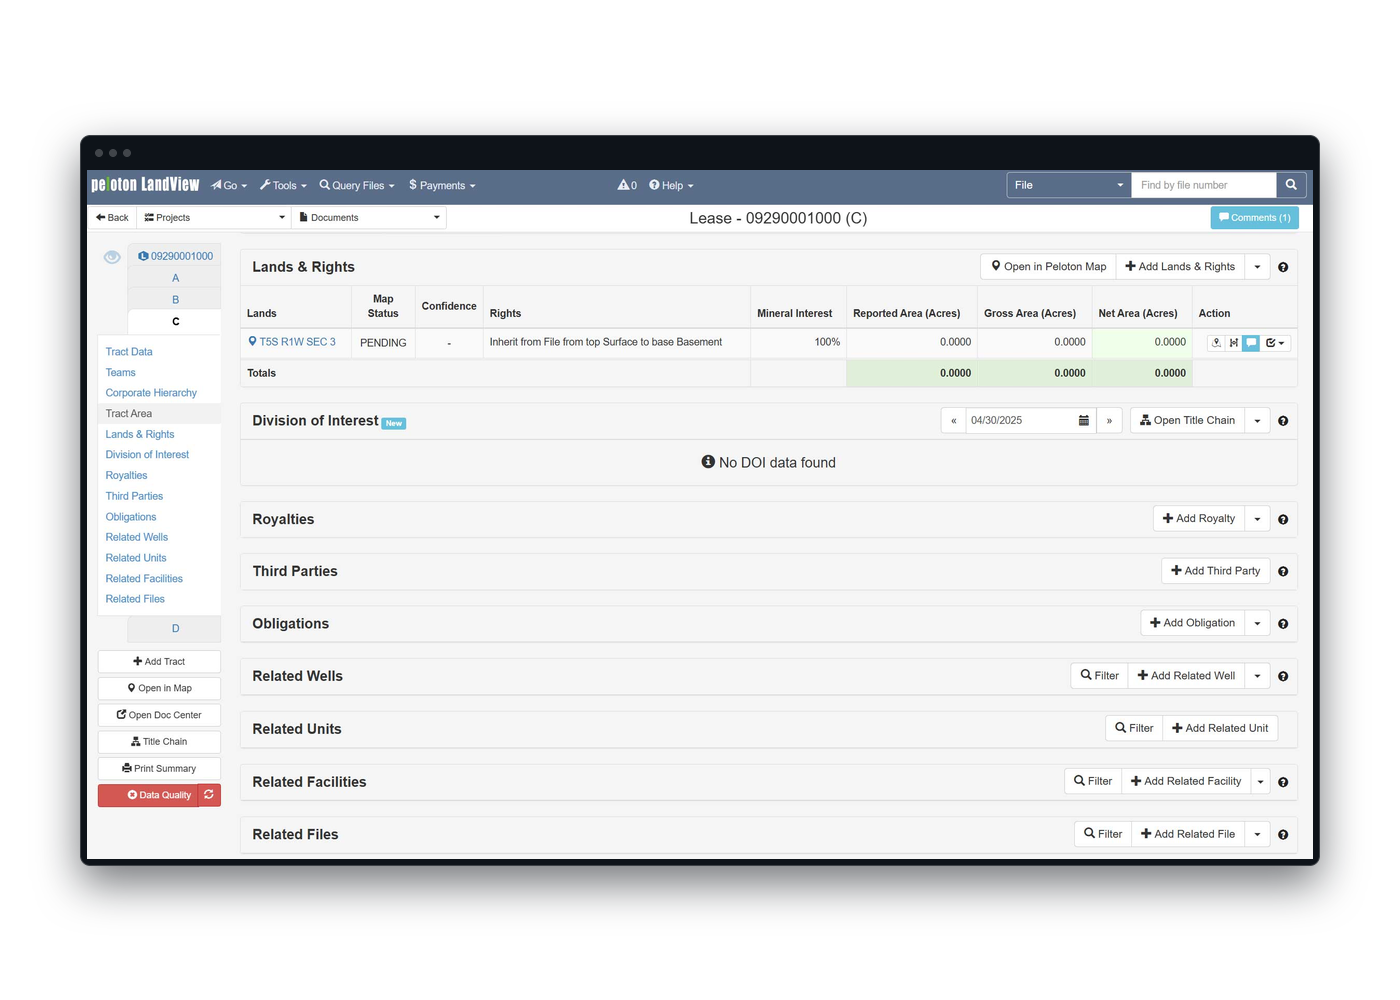
Map on the Lease: A LandView lease record shows its geospatial view from LandView Map on the same screen.
One Click: Move between the map and applications like LandView with a single click, preserving context and saving time across workflows.
Start in LandView: Start in LandView, and bring in Map when location adds value.
Highlight obligations, lease areas, or well activity using flexible filters and spatial queries.
Custom Queries: Create spatial queries to visualize assets, track obligations, and support planning.
Ownership and Lease Activity: Visualize ownership and lease activity across tracts and regions.
Location Questions: Ask what location-specific constraints the team should consider, and where an obligation could affect the broader acreage picture.
Snapshot Sharing: Zoom into map areas and extract lists or images for analysis and communication.
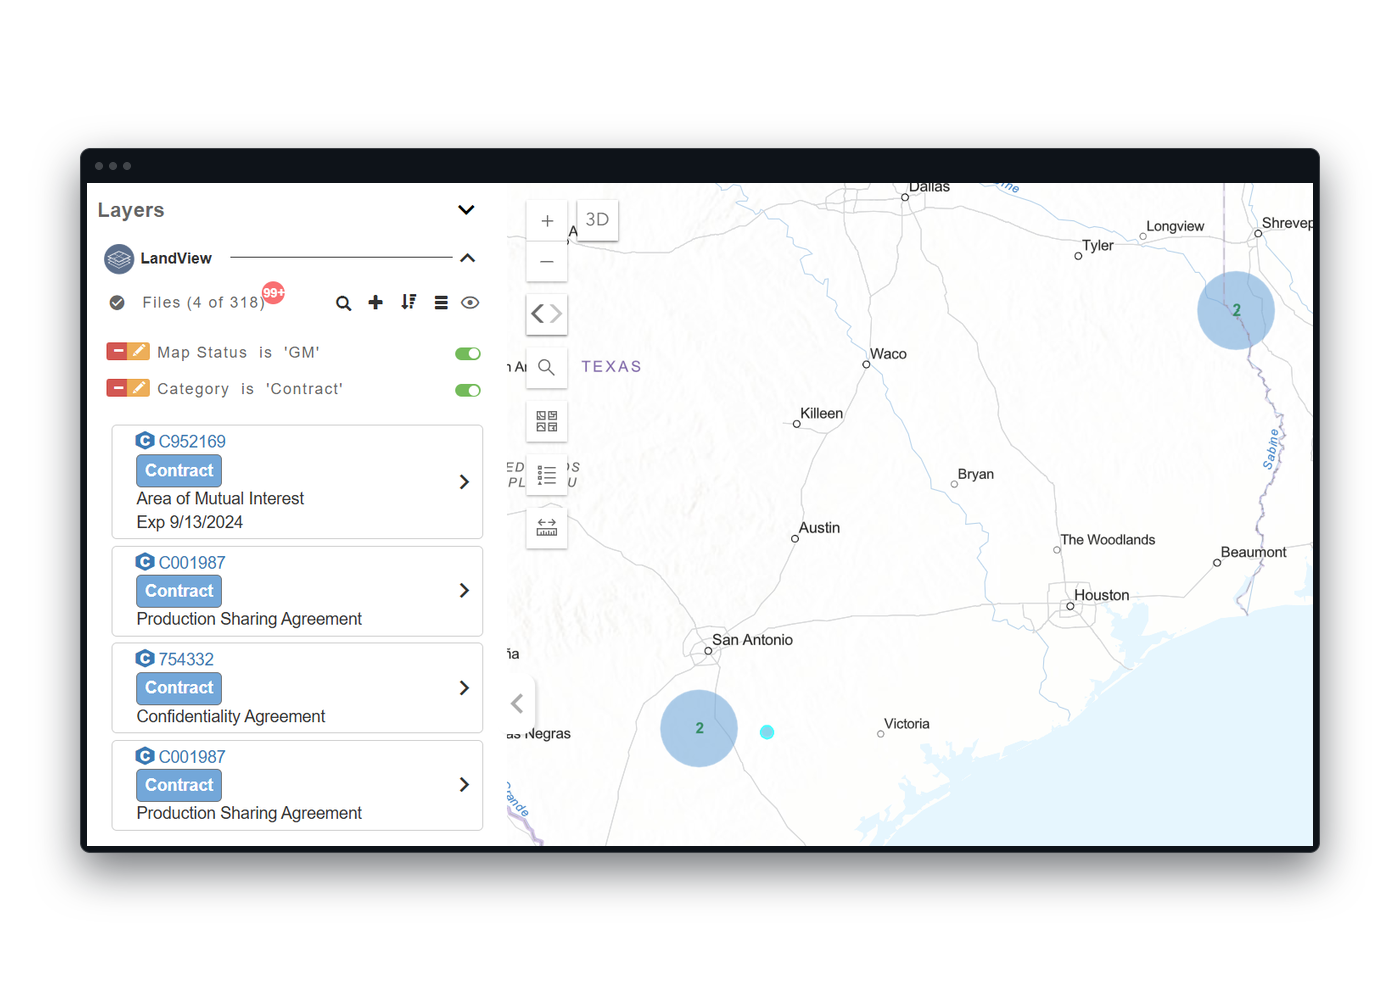
Overlay Peloton data with regulatory, environmental, or third-party sources to get the full picture. Use geospatial information for linear projects to support midstream, renewables and transmission operations.
Esri ArcGIS Compatible: Use existing GIS layers and templates to complement your internal views.
Layer Enrichment: Overlay jurisdictional or regulatory boundaries for improved planning and awareness.
Third-Party Layers: Combine Peloton data with third-party layers for deeper operational awareness.
Overlay-Driven Insights: Layer environmental boundaries, jurisdictional zones, or competitor wells to enhance local analysis.
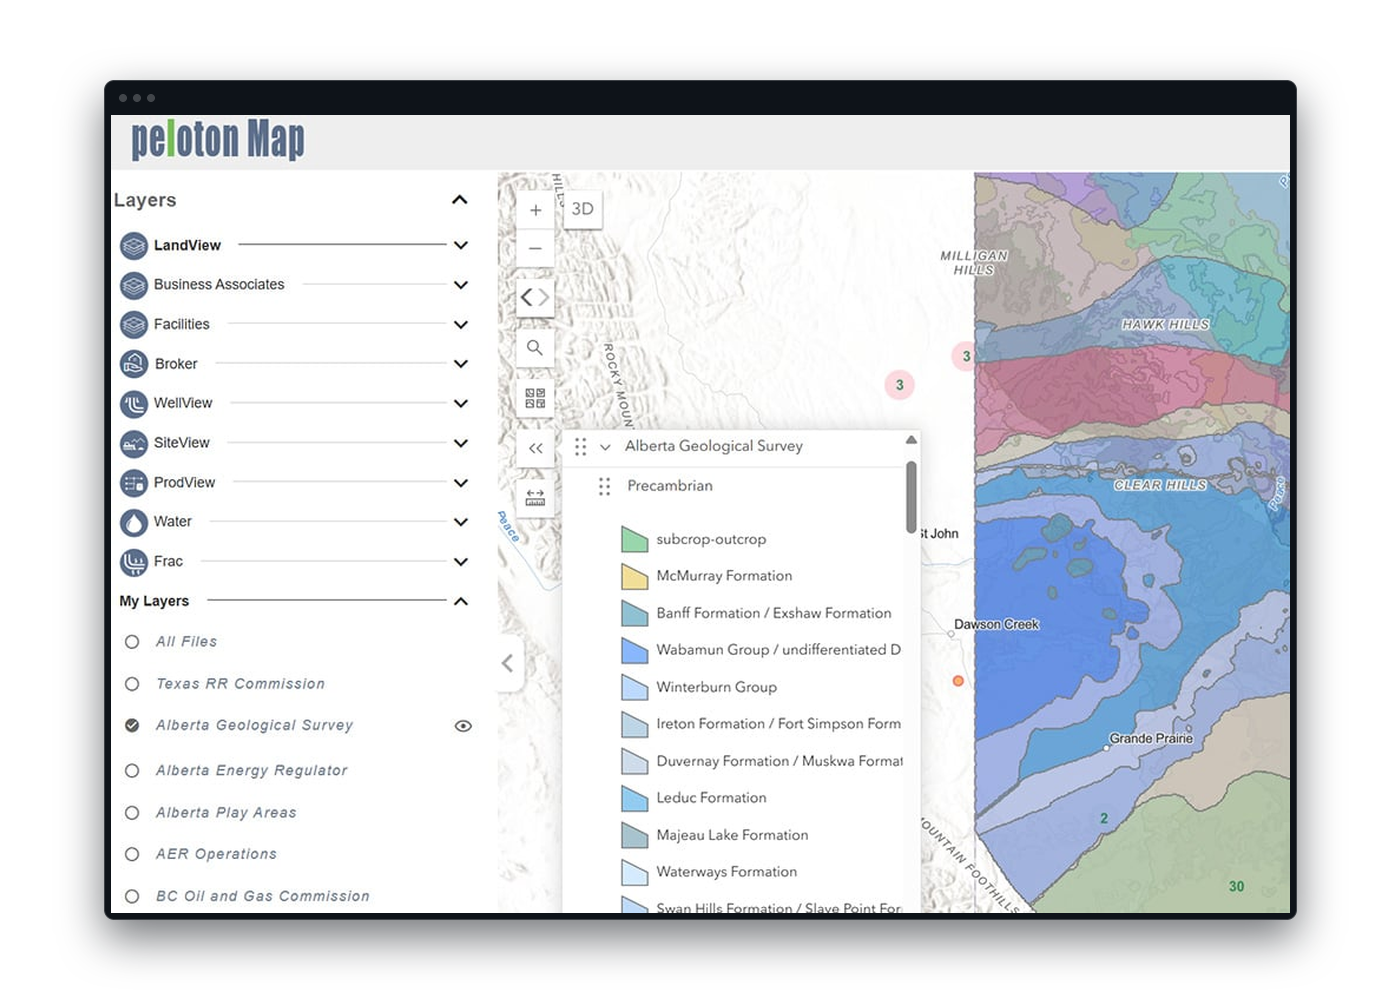
LandView Map empowers teams to analyze spatial data directly in the interface—visualizing what’s happening, where, and why. From acreage comparisons to prospect-level summaries, LandView Map connects visual context with operational insight, helping you identify patterns, validate data accuracy, and support better planning decisions. No exports or external systems required to get started.
Graphical Displays: View charts and activity breakdowns tied to mapped records from LandView or SiteView.
CSV Export: Generate spreadsheets from selected map areas when deeper analysis or documentation is needed.
Confidence Comparisons: Compare mapped acreage with recorded values to flag discrepancies or validate accuracy.
Prospect-Based Summaries: Run spatial queries by prospect to visualize lease obligations, surface rights, and permit coverage.
Map-to-Action Auditing: Quickly identify mismatches between mapped locations and operational records—before they impact reporting.
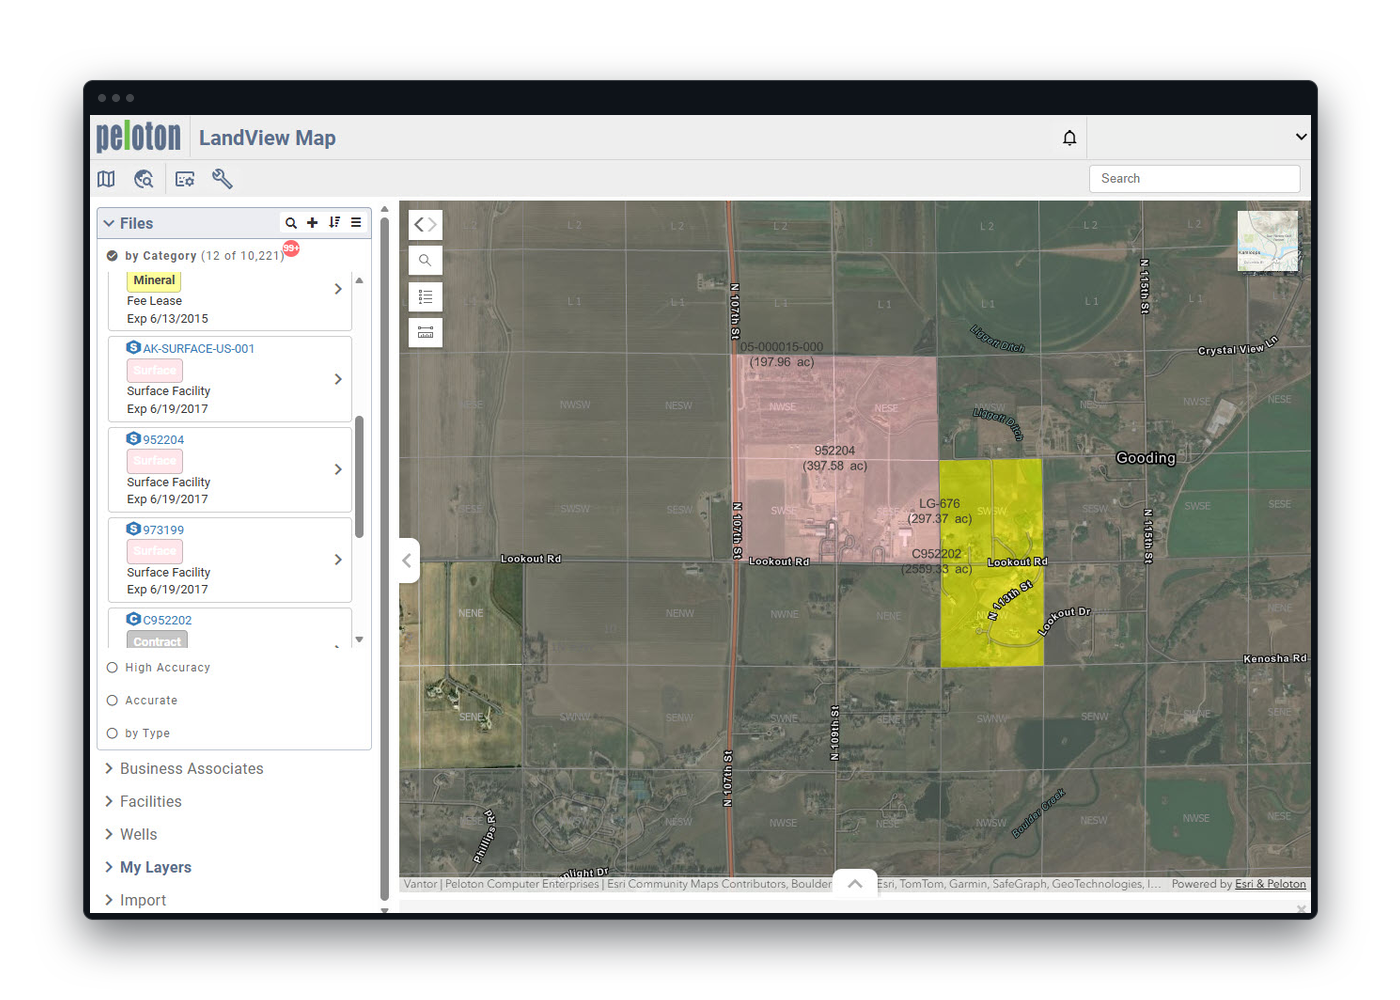
LandView Map delivers a clean, modern interface built for operational clarity. Whether you’re reviewing lease boundaries, tracking wells, or planning infrastructure, the intuitive layout makes it easy to explore, filter, and act on spatial data. No GIS expertise required. With direct links to Peloton applications and layered visualization tools, your team gets the full picture, faster.
Modern Mapping Interface: Navigate spatial data with simple zoom and pan controls, or jump to an asset from a linked record in LandView or WellView.
Built-In Queries: Create visual queries to filter leases, wells, or obligations by location or status directly from Peloton applications.
3D Visualization: Explore directional well paths and formations in 3D. Early-stage functionality for use cases that benefit from subsurface perspective.
Layer Management: Turn data layers on or off, including Peloton records and external GIS sources—to tailor your view for planning or review.
Cloud Access: Log in from any browser, no local software needed. View and interact with maps from the field, the office, or on the move.
Save & Revisit Areas of Interest: Bookmark key map regions to quickly return to frequently analyzed assets, lease blocks, or project zones.