Skip to content
Peloton Water

Peloton Platform

Peloton Water

Complete Water Lifecycle Management in One Platform


Peloton Water centralizes sourcing, transport, usage, and disposal in a single system helping teams control costs, ensure compliance, and track every drop from field to office. With built-in flow diagrams and audit-ready reports, it simplifies planning, execution, and optimization across the full water lifecycle.

Request A Demo

Part of the

PRODUCTION DATA 
LIFECYCLE

production-icon ProdView
ProdView Go
Multiple reports, schematics, and timetracks (or any combination) appear side by side. Think of it as your single well dashboard.
prod-go-icon-color ProdView
Go
ProdView
Go
Go
Multiple reports, schematics, and timetracks (or any combination) appear side by side. Think of it as your single well dashboard.
drop Peloton

Water
Peloton

Water
Go
Multiple reports, schematics, and timetracks (or any combination) appear side by side. Think of it as your single well dashboard.
ops-logo-1 Peloton
Ops
Peloton
Ops
Go
Multiple reports, schematics, and timetracks (or any combination) appear side by side. Think of it as your single well dashboard.

Centralized Water

Lifecycle Management

Unify sourcing, movement, and disposal workflows in one platform. 

One Platform.
Full Lifecycle Control.

Frame
Tablet (1)
software-img
Mobile
software-img
(PWATER) Planning Module
Planned vs. Actual
Usage Tracking

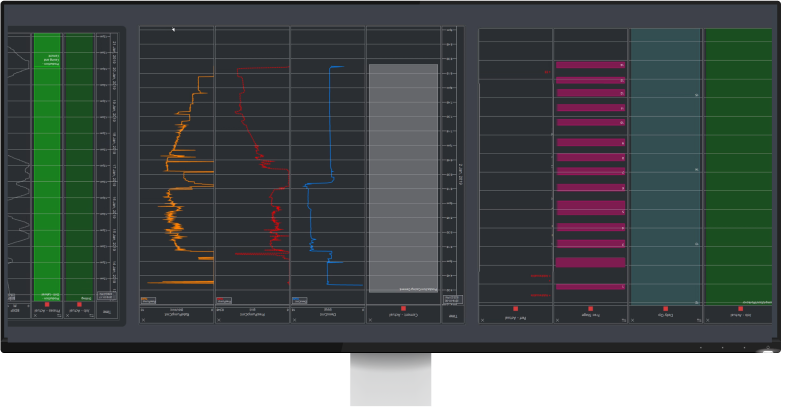
Compare planned and actual volumes with built-in variance tools that help field teams spot issues and make timely adjustments.

Plan. Monitor. Optimize.

compliance-tools
Built-In
Compliance Tools

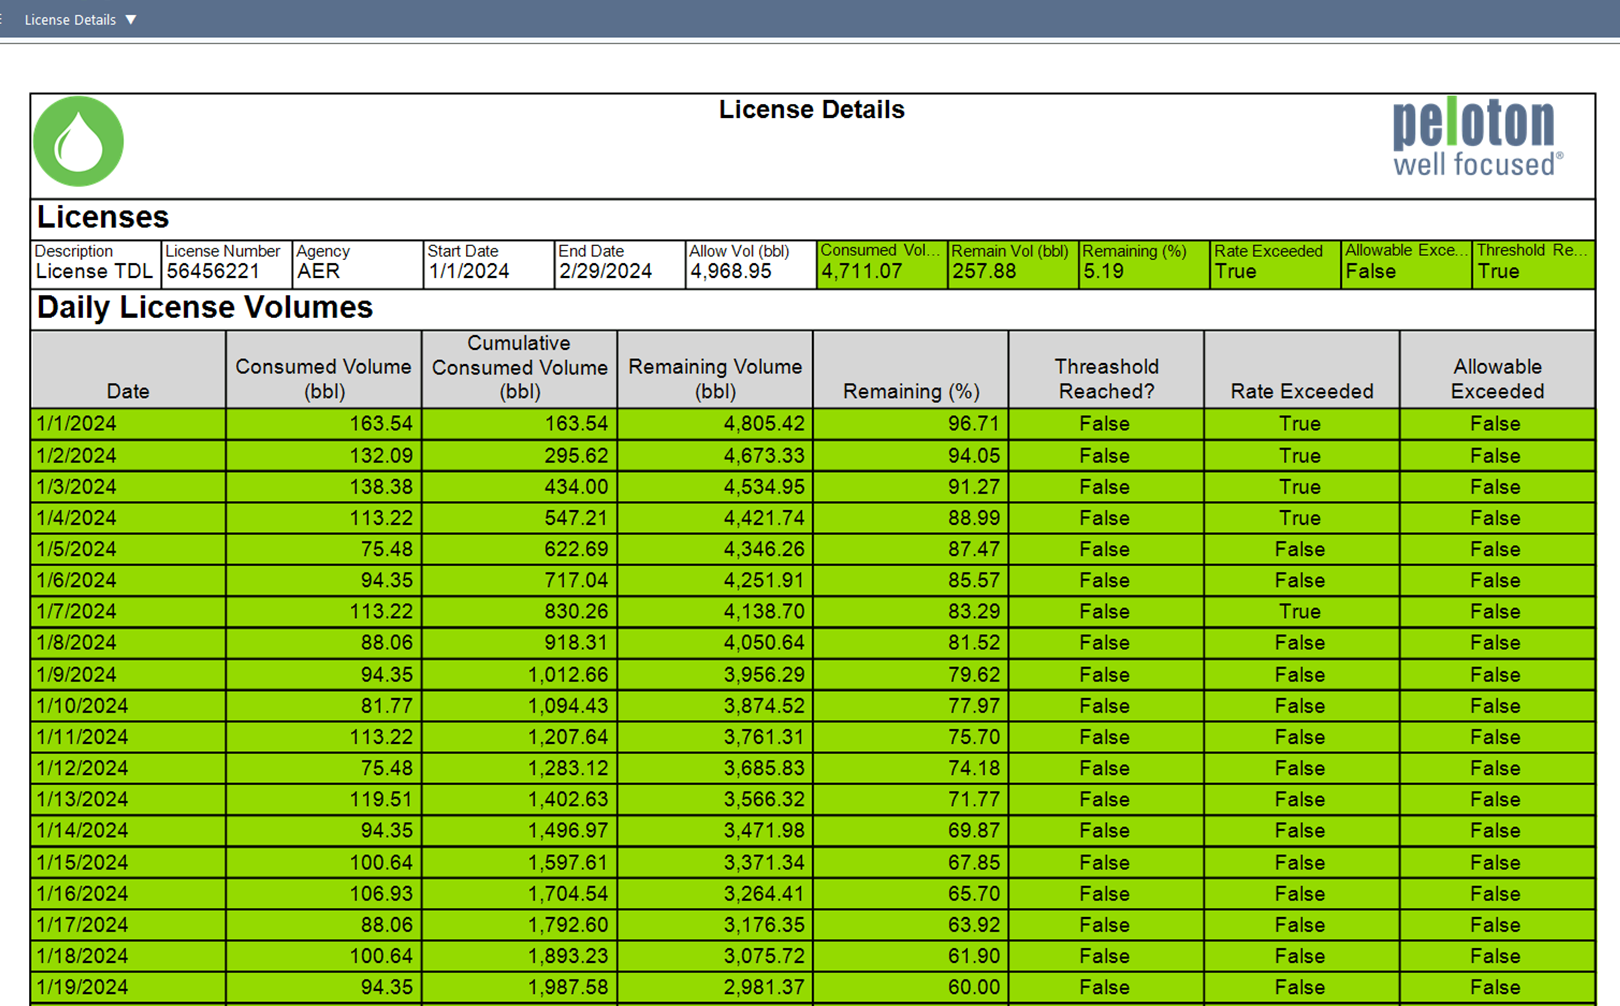
Automate threshold alerts, track usage by region or well, and generate audit-ready reports to meet jurisdictional regulations.

Always Aligned. Always Accountable. 

banner-bg-2
Optimize
Water Moves with Data

Leverage historical usage trends and network performance to improve water transport planning, eliminate inefficiencies, and reduce costs across all stages of the water lifecycle.

Smarter Planning. Lower Spend. 

flows
Flow Network
Visualization for Water

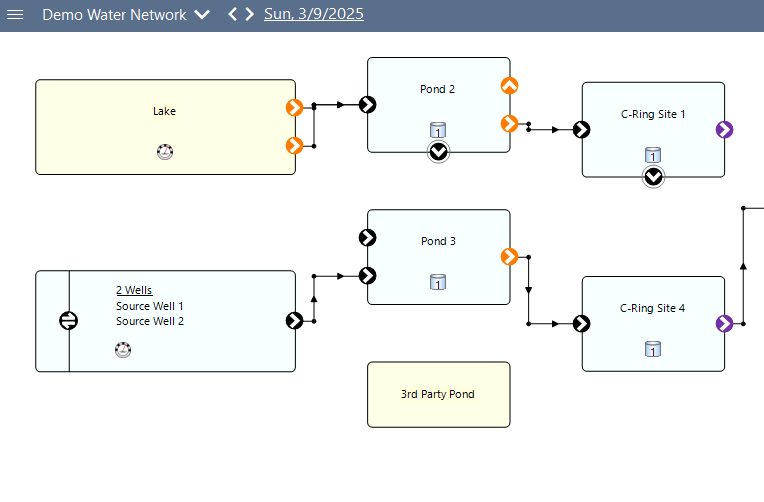
Visualize water routing, flow volumes, and system dependencies through the Flow Network Diagram.

See the System. Optimize the Flow.

Request a Demo
production-icon2

Peloton Platform

Peloton Water

Request a Demo

What Sets Peloton Water Apart

Peloton Water unifies sourcing, logistics, and compliance in one platform—eliminating silos and inefficiencies. From transfer approvals to audit-ready reports, it helps teams manage every drop with precision and less overhead.

Request a Demo
Interactive Flow Network Diagram
Visualize water routing, system dependencies, and infrastructure capacity using date-effective network modeling tools.
Web-Based Job Sheets for Field Entry
Log, review, and approve water jobs from any location to support fast, accurate field-to-office workflows.
Automated Licensing & Permit Controls
Monitor thresholds, track permit status, and simplify regulatory compliance across jurisdictions (TDL, PDL, state/provincial, and federal).
Planning Tools for Smarter Sourcing & Storage
Leverage historical water usage and movement trends to improve forward planning and reduce redundancy.
SCADA, WellView Allez & ProdView Integration
Consolidate operational oversight by connecting with existing production and infrastructure systems.
Built-In Compliance & Alerting
Enable proactive compliance with automated reports, regional thresholds, and usage monitoring in a single interface.

Enterprise-Scale Water Management & Compliance

Peloton Water is designed for teams managing high volumes, complex logistics, and evolving regulations, whether at the basin or enterprise level. With centralized visibility and structured data capture, it helps operations reduce cost, mitigate risk, and improve sustainability outcomes.


Key benefits include:

Reduce manual effort while improving accuracy and reporting completeness.
Monitor water use, system performance, and key planning metrics with flexible, user-defined dashboards.
Maintain data integrity with enterprise-grade access controls and permission settings.
Generate operational and compliance reports quickly, without relying on IT.
Easily deploy across teams, regions, or corporate structures—adaptable to both local and enterprise needs.
Built-in validation tools flag anomalies and ensure data reliability across the water network.
Streamline compliance with jurisdiction-specific reports and sustainability tracking tools.
Access Peloton’s expert services team for onboarding, troubleshooting, and operational best practices.
drop

Peloton Platform

Peloton Water

Request a Demo

Turn Water Data into Operational Intelligence

Peloton Water converts lifecycle data into smarter plans and stronger compliance. With validation tools and role-based dashboards, it helps teams manage high-volume operations with confidence. 

Request a Demo
Water Usage & Flow Monitoring
Track usage and flow trends across the network, including transfer volumes and storage changes.
Historical Demand Planning
Analyze past usage patterns and operational events to improve sourcing and disposal strategies.
Automated Compliance Reporting
Generate jurisdiction-specific reports using built-in templates for regulatory and ESG tracking.
Network Visualization with System Context
View the full water network with overlays for flow paths, meters, and infrastructure dependencies.
Variance Detection & Data Validation
Identify discrepancies and incomplete entries before they impact planning or reporting.
Role-Specific Dashboards & Filters
Tailor analytics by user, asset, or region to surface the insights that matter most to each team.
drop

Peloton Platform

Peloton Water

Request a Demo

A Visual Command Center for Water

Peloton Water brings routing, metrics, and planning tools into one intuitive view so teams can spot issues fast and manage with precision. 

Request a Demo
Interactive Water Dashboards
Monitor usage, variance, and compliance thresholds through configurable reports/dashboards built for operational context.
Integrated Water Data Sources
Access water volume and routing data from SCADA, field entry, and transfer logs—all in one centralized interface.
Flow Network Diagram for Water Movement
Visualize transfer paths, infrastructure capacity, and storage nodes with date-effective modeling tools.
Facility-to-Field Traceability
Navigate sourcing, transfers, and disposal routes visually—supporting operational review and regulatory audits.
Exception-Based Visual Alerts
Surface usage anomalies and threshold breaches with color-coded variance indicators and system-wide flags.
Historical Trend Overlays
Compare water usage trends over time to support performance reviews and forward planning.
drop

Peloton Platform

Peloton Water

Request a Demo

One Water Platform. Fully Connected.

Peloton Water integrates with Peloton applications and third-party systems to unify oversight, keeping water data aligned, auditable, and accessible. 

Request a Demo
ProdView & WellView Allez Integration
Connect water volumes and movement with production workflows and operational history for full lifecycle traceability.
SCADA, Sensor & Field Device Integration
Feed measured water volumes from the field directly into the platform for planning, compliance, and exception tracking.
ERP & Environmental Systems
Link with enterprise platforms for asset management, regulatory reporting, and sustainability initiatives.
Flexible API Access
Extend data to BI tools, sustainability platforms, or internal dashboards using Peloton’s API and ETL services.
Flow Network Diagram Integration
Route water volumes and infrastructure changes through the FND for system-wide visibility and operational impact.

Looking for more info

Dig Deeper

Hide Info

Looking for less info

Client Testimonials
Peloton delivers robust data capture and reporting across the well lifecycle, backed by top-tier support and a visionary, unified app strategy."
D&C Manager
quote
Peloton puts more real-time R&D in their products than any other oil and gas software vendor out there, and I have used a lot of them."
Engineering Technician
quote
Having our production data in the Peloton data model through ProdView has given us seemingly infinite integration possibilities with SiteView and WellView data."
Area Engineer
quote

EXPLORE THE PRODUCTION DATA LIFECYCLE

Request A Demo

Part of the

PRODUCTION DATA LIFECYCLE

Group 1502 1 ProdView
ProdView Go
Multiple reports, schematics, and timetracks (or any combination) appear side by side. Think of it as your single well dashboard.
prod-go-icon-color ProdView
Go
ProdView
Go
Go
Multiple reports, schematics, and timetracks (or any combination) appear side by side. Think of it as your single well dashboard.
drop Peloton
 Water
Peloton
 Water Go
Multiple reports, schematics, and timetracks (or any combination) appear side by side. Think of it as your single well dashboard.
ops-logo-1 Peloton
 Ops
Peloton
 Ops Go
Multiple reports, schematics, and timetracks (or any combination) appear side by side. Think of it as your single well dashboard.