Skip to content
Group 1502

Peloton Platform

ProdView

Transform Field Data into Production Intelligence


In modern production data environments, delays, fragmented systems, and manual processes can drive up costs and increase compliance risks. ProdView solves these challenges by unifying well, facility, gathering system and production operations data into one intelligent platform. From field data capture to regulatory reporting and production optimization, ProdView delivers structured, validated insights that enable teams to respond faster, allocate resources more precisely, and drive continuous improvement - from the field to the front office.

Request A Demo

Part of the

PRODUCTION DATA 
LIFECYCLE

production-icon ProdView
ProdView Go
Multiple reports, schematics, and timetracks (or any combination) appear side by side. Think of it as your single well dashboard.
prod-go-icon-color ProdView
Go
ProdView
Go
Go
Multiple reports, schematics, and timetracks (or any combination) appear side by side. Think of it as your single well dashboard.
drop Peloton

Water
Peloton

Water
Go
Multiple reports, schematics, and timetracks (or any combination) appear side by side. Think of it as your single well dashboard.
ops-logo-1 Peloton

Ops
Peloton

Ops
Go
Multiple reports, schematics, and timetracks (or any combination) appear side by side. Think of it as your single well dashboard.

Simplified

Field Data Capture

Capture production data at the source, online or offline, with easy-to-use mobile forms, voice-to-text, photo capture, and built-in validation. 

Capture Once.
Trust the Results.

Frame
Tablet (1)
software-img
Mobile
software-img
ops-dashboard
Well & Equipment
Surveillance

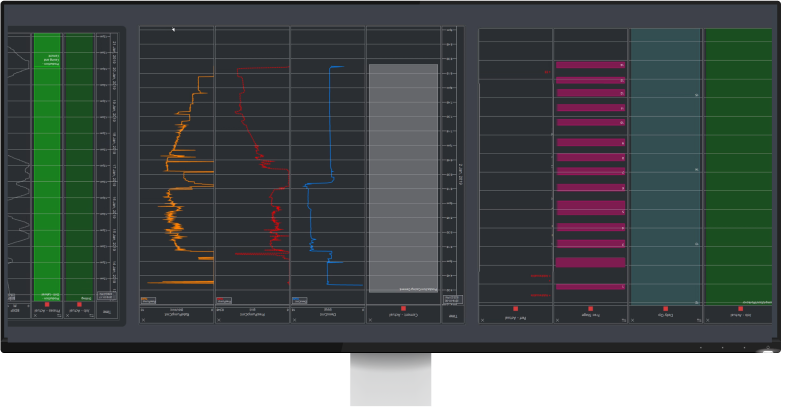
Monitor well performance with configurable production plots that display trends, anomalies, and key performance indicators. Compare wells or groups, normalize output, and track progress against targets to drive faster, smarter decisions.

Monitor Smarter. Act Faster.

flow-networks
Native Integration with
WellView Allez

Unify production and well operations in a single, connected workflow. Downtime entries in ProdView Go automatically create failure records in WellView Allez, while engineers can view WellView jobs directly on production plots and access schematics and workover details without switching tools.

One Connection. Complete Context.

allocation-exceptions
Production Accounting and Regulatory Reporting


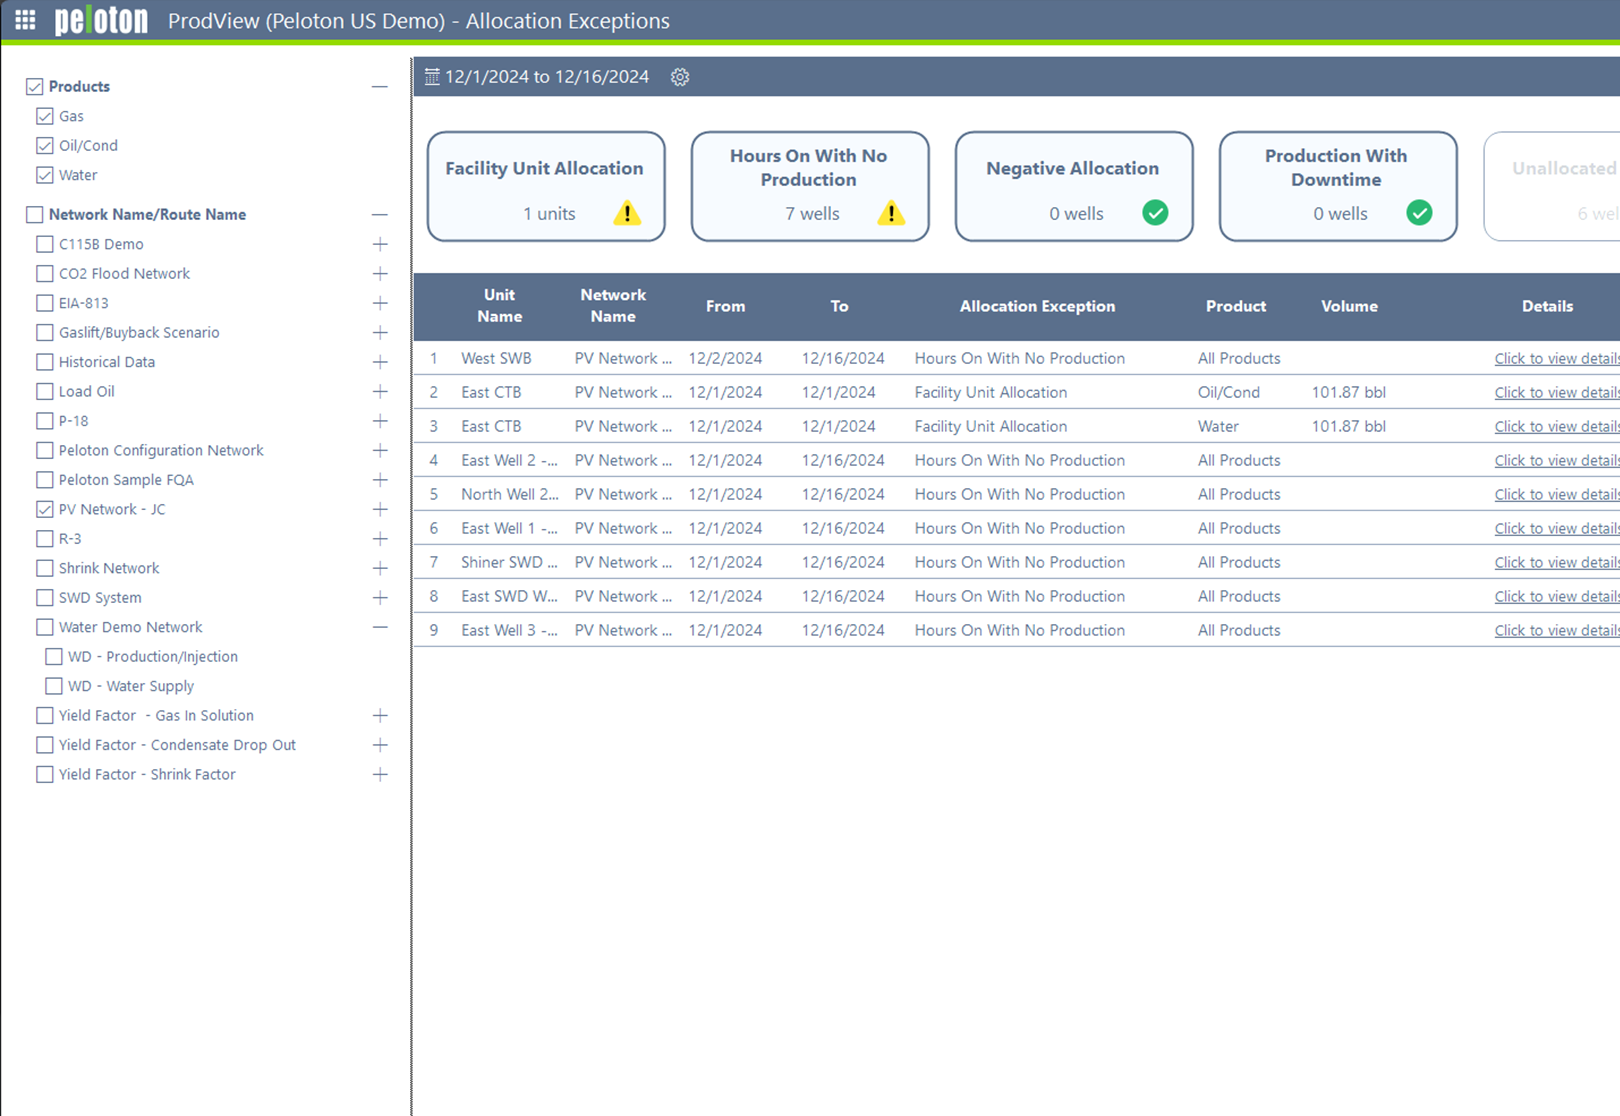
Simplify month-end with one system for allocations, reconciliation, and jurisdiction-specific compliance. ProdView accelerates closeout and ensures accuracy every step of the way.
Accurate Allocations
Accurate Allocations: Handle complex, multi-tiered scenarios with built-in validation and date-effective flow modeling.
Streamlined Reconciliation
Streamlined Reconciliation: Trace discrepancies to the source and resolve issues fast, without reruns or delays. 
Audit-Ready Reporting
Audit-Ready Reporting: Generate jurisdiction-specific reports with the industry’s most complete regulatory library. Close Faster.

Report with Confidence.

production-manager
Production Monitoring with
Built-In Trends

Track what matters with configurable monitors and surveillance tools that reveal trends, compare performance, and guide operational decisions. Built-in normalization and decline curve analysis highlight actionable insights faster, so you can act with confidence.

Monitor What Matters. Act with Insight.

emissions
Integrated
Emissions Tracking

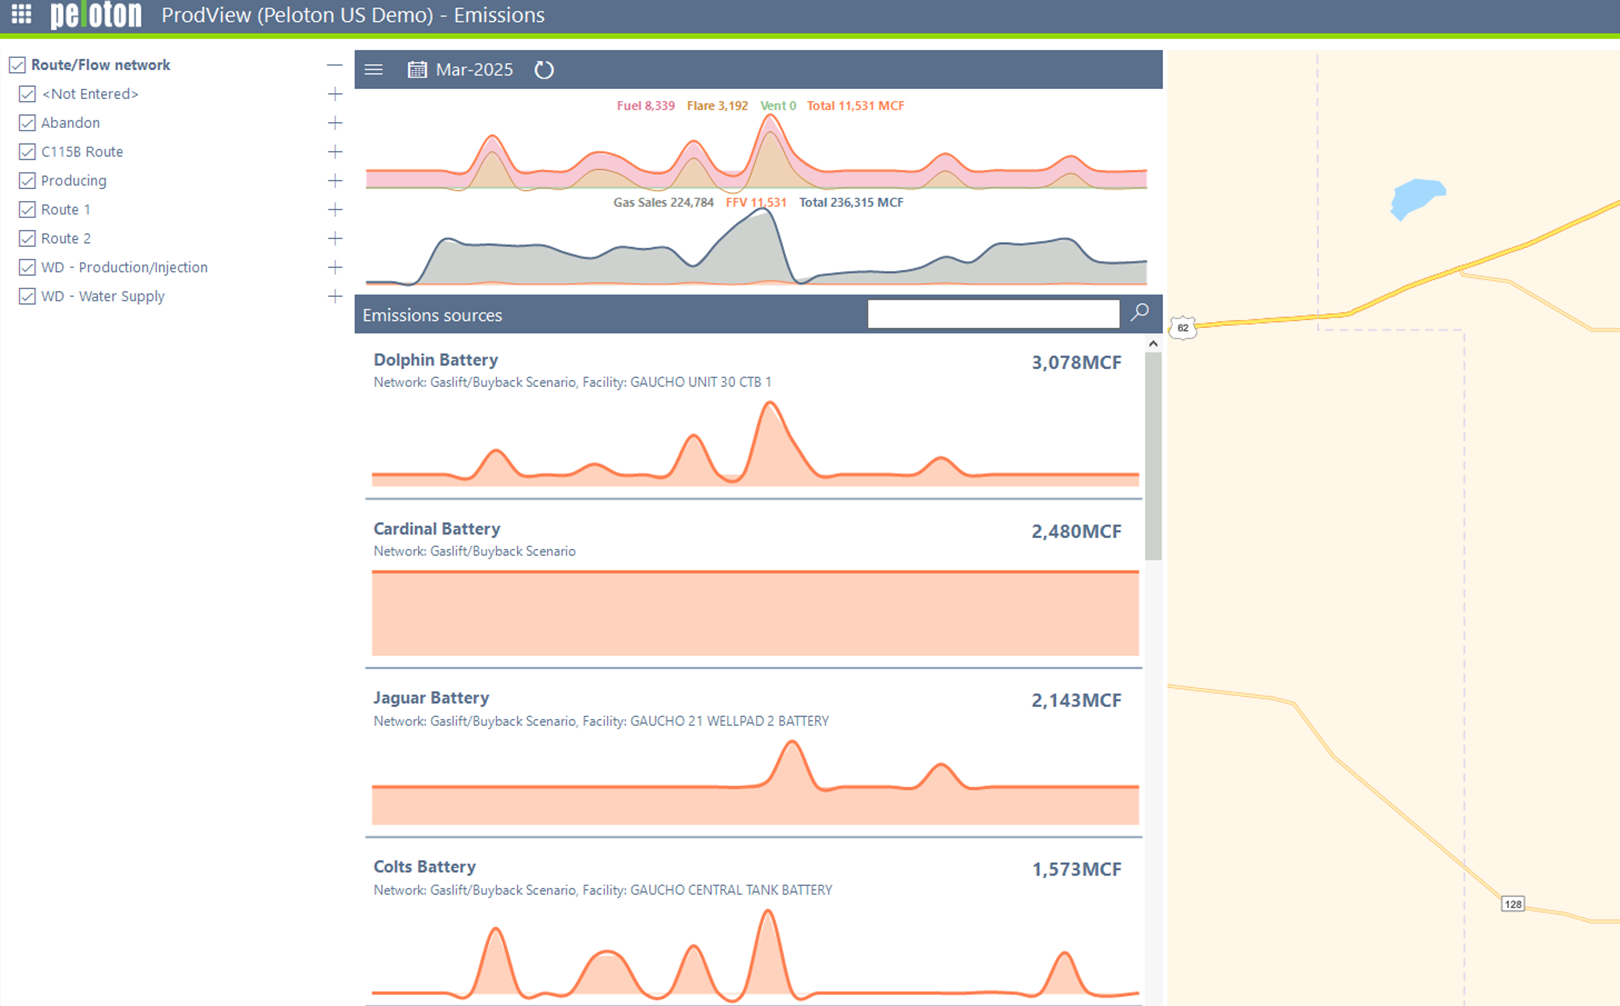
Track fuel, flare, and vent volumes directly within your production workflows. ProdView ensures consistent, auditable emissions data to support internal goals and external reporting.

Track Emissions. Stay Compliant.

Request a Demo
Group 1502 1

Peloton Platform

ProdView

Request a Demo

What Sets ProdView Apart

Made for real-world work. Old tools slow you down—ProdView gives your team the accuracy and control to stay sharp and get the job done right

Request a Demo
WellView Allez Integration for Full Operational Context
View WellView jobs on production plots, and access downhole schematics and workover history directly from ProdView to support faster diagnostics and better decision-making.
Timely Field Visibility
Access current production data from the field without manual syncing or uploads.
Accurate Allocation Workflows
Reduce delays and manual effort with multi-tiered, date-effective allocations and built-in volume validation.
Exception-Driven Oversight
Identify anomalies early using automated alerts, tolerance flags, and audit-ready exception logs.
No SQL Required
Customize reports, workflows, and regulatory forms without relying on IT teams.
Self-Administration at Scale
Adapt the platform to your operations with easy configuration and enterprise-level scalability.

Production Optimization Made Simple

Stop managing data. Start managing production. ProdView removes the bottlenecks that slow down daily decisions, helping teams optimize workflows, reduce downtime, and act on trends with clarity and confidence.

Automatically identify data quality issues, volume imbalances, and abnormal trends before they impact operations.
Maintain strict access control with role-based permissions and secure deployment options.
Visualize dependencies, update configurations, and manage flow path changes in one system.
Track fuel, flare, and vent emissions and generate reports for 20+ jurisdictions.
Deploy across teams, assets, and regions with full self-administration and configuration control.
Connect with SCADA, WellView Allez, and enterprise systems for unified oversight and streamlined workflows.
Group 1502 1

Peloton Platform

ProdView

Request a Demo

Turn Production Data into Action

ProdView combines current field data, history, and exception logic to support confident, data-driven decisions—from daily operations to month-end reporting.
Request a Demo
Surveillance Across Wells, Facilities & Flow Networks
Detect performance issues and volume gaps using system-wide trending and threshold alerts.
Exception-Based Monitoring & Tolerance Flags
Detect deviations in production, allocation, or equipment activity with intelligent rule-based triggers.
Historical Trend Analysis
Compare periods, overlay trends, and visualize delta shifts over time to support long-term optimization.
Regulatory Compliance Analytics
Track fuel, flare, and vent emissions across jurisdictions and audit production volumes with confidence. Peloton maintains and proactively updates the industry’s most comprehensive regulatory reporting library, so you’re always aligned with the latest requirements.
Visualization Tools
Build dashboards and compare production by region, asset, or operational criteria with flexible filters.
Role-Specific Data Views
Customize how data is displayed based on each user’s region, responsibility, or workflow.
Group 1502 1

Peloton Platform

ProdView

Request a Demo

A Visual Command Center for Production

ProdView simplifies complex operations with visual workflows, exception alerts, and dashboards—helping teams spot issues, understand dependencies, and act fast.

Request a Demo
Interactive Production Trending
Track performance by well, facility, or region with configurable visualizations and production metrics.
Exception Visualization & Alerting
Highlight anomalies and tolerance breaches with dynamic visual cues—no digging required.
Flow Network Schematic View
Navigate production routes, entry points, and flow paths in a connected, node-based interface.
Trend & Surveillance Views
Compare performance over time with normalized views, stacked charts, and decline curve overlays.
Drill-Down Monitoring
Zoom into meters, tanks, or batteries for targeted diagnostics and operational insight.
Role-Based Permissions
Tailor each user's view based on asset responsibility, workflow needs, or operational role.
Group 1502 1

Peloton Platform

ProdView

Request a Demo

Integrated by Design.

ProdView connects with Peloton applications and external systems to unify production—from field capture to compliance—keeping data connected and complete.
Request a Demo
WellView Allez & SiteView Allez Integration
Create a well in WellView Allez and have it appear automatically in ProdView. Connect operational and production data to well history, site activity, and failure events across the asset lifecycle.
Dashboards Launched from ProdView Go
Access production trends, schematics, and KPIs without leaving the mobile workflow.
Peloton Map Compatibility
Visualize production performance in spatial context with asset-level overlays and routing dependencies.
ERP & Regulatory Systems
Connect to compliance tools, asset registries, and enterprise maintenance platforms to close the loop between field activity and back-office reporting.
SCADA, IoT, and Sensor Data Feeds
Ingest field telemetry and sensor data into ProdView for timely operational awareness and exception tracking.
Open API & Secure Cloud Access
Extend ProdView’s capabilities across your enterprise with flexible API endpoints and encrypted, role-based cloud access.

Looking for more info

Dig Deeper

Hide Info

Looking for less info

Client Testimonials
ProdView is a helpful software used by admin, user, and radio operator for the input of daily data production and regulatory reporting. Hopefully ProdView can be the market leader for management data production software."
G&G Data Management
quote
ProdView is a well-organized application that is reliable and simple to use. The Network Configuration Tool is a neat feature that allows users to add or make edits to a large selection of data which improves productivity."
Production Analyst
quote
I really appreciate the effort, professionalism and responsiveness that Peloton has demonstrated throughout our ProdView implementation process."
Engineer
quote
ProdView is very easy to implement. We relied on Peloton for the initial implementation, but can now integrate acquisitions very easily in-house."
Area Engineer
quote

EXPLORE THE PRODUCTION DATA LIFECYCLE

Request A Demo

Part of the

PRODUCTION DATA LIFECYCLE

Group 1502 1 ProdView
ProdView Go
Multiple reports, schematics, and timetracks (or any combination) appear side by side. Think of it as your single well dashboard.
prod-go-icon-color ProdView
Go
ProdView
Go
Go
Multiple reports, schematics, and timetracks (or any combination) appear side by side. Think of it as your single well dashboard.
drop Peloton
 Water
Peloton
 Water Go
Multiple reports, schematics, and timetracks (or any combination) appear side by side. Think of it as your single well dashboard.
ops-logo-1 Peloton

Ops
Peloton

Ops
Go
Multiple reports, schematics, and timetracks (or any combination) appear side by side. Think of it as your single well dashboard.