Skip to content
dashboards-icon

Peloton Platform

Peloton Dashboards

Clear, Actionable Views Across the Platform


Peloton Dashboards provide clear, actionable insights across the Peloton Platform through a web-based interface. No extra setup required. Built by domain experts, not IT, Dashboards help engineers, operations teams, and managers surface key trends and KPIs using configurable visualizations designed for real workflows.

Request A Demo

Part of the

WELL DATA
LIFECYCLE

wellview-icon-small WellView Allez
WellView Allez Go
site-view SiteView
Allez
SiteView
Allez
Go
siteview-go-icon-color SiteView
Go
SiteView
Go
Go
innova-1 Peloton
 Innova
Peloton
 Innova Go
frac Peloton
Frac
Peloton
Frac
Go
well-integrity Well
Integrity
Well
Integrity
Go

Custom

Visualizations

Focus on the insights that matter most with dashboards tailored to your workflows, roles, and business objectives.

Visualize
What Matters

Frame
Dash-1
Tablet (1)
software-img
Mobile
software-img
Dashboard-2
Role-Specific
Dashboards

Deliver insights tailored to engineers, ops managers, and executives.

Right Views for the Right Roles.

dashboards-3
Built-On
Peloton ETL

Dashboards rely on Peloton’s ETL to deliver trusted, consistent data from across the Platform, ensuring accuracy and eliminating manual prep.

Trusted Data. No Extra Work.

no-it
No IT
Bottlenecks

Empower teams to build and update dashboards without relying on IT.

Control in Your Hands.

Dashboards-Mobile
Mobile-Optimized
Dashboards

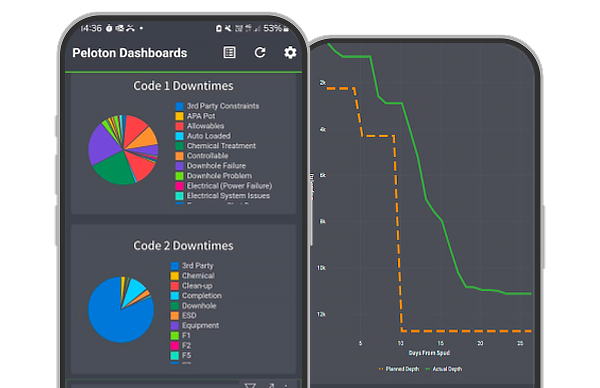
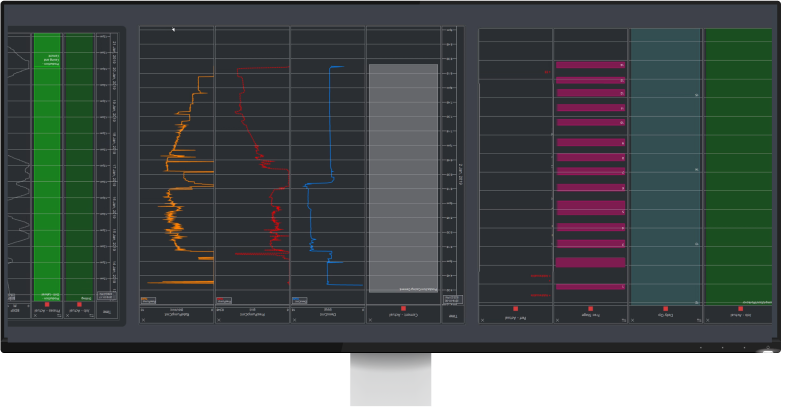
Access operational dashboards from any device with responsive design and secure platform connectivity, enabling field teams to monitor metrics, flag anomalies, and make informed decisions without returning to the office.

Operational Awareness, On the Go.

Request a Demo
dashboards-icon

Peloton Platform

Peloton Dashboards

Request a Demo

What Sets Peloton Dashboards Apart

Unlike traditional tools built by IT, Peloton Dashboards are created by the teams who use them. With direct access to platform data and no external setup, users can build role-specific views that reflect real operational workflows, delivering the right insights to the right people, fast.
Request a Demo
Monitor Operational Activity
Track well performance and field operations with dashboards built for engineering workflows: from single-well to multi-well views.
Assess Organizational Performance
Create rollups for departments or corporate leadership to monitor uptime, production efficiency, and other high-level KPIs.
Deliver Insights by Role
Configure dashboards by job function, ensuring engineers, ops managers, and executives get tailored, relevant insights.
Support Field-Based Decision-Making
Enable on-site teams to view critical dashboards on mobile, keeping decisions aligned even when offline.
Unify Platform Metrics
Bring together data from across Peloton applications in one place, removing silos and manual exports.
Empower Business Users
Allow teams to build, modify, and manage dashboards independently, without waiting on IT or external developers.

Insight That Drives Action

Peloton Dashboards turn platform data into practical insight, helping teams make faster decisions, align across roles, and reduce reliance on IT. From daily operations to strategic oversight, dashboards deliver value at every level. 


Get the right information in front of the right people quickly, so teams can respond to issues and opportunities with confidence.
Ensure engineering, operations, and leadership are working from the same data and metrics—without duplicate effort or miscommunication.
Integrate offset well production and pressure data to identify fracture-driven interactions and respond more effectively to potential issues.
Visualize performance at every level, from field activity to corporate KPIs,helping leaders spot trends and act early.
Make platform data easier to interpret and act on through focused visualizations designed around real workflows.
Deploy dashboards across the organization with consistency, whether for a single asset or an entire business unit.
dashboards-icon

Peloton Platform

Peloton Dashboards

Request a Demo

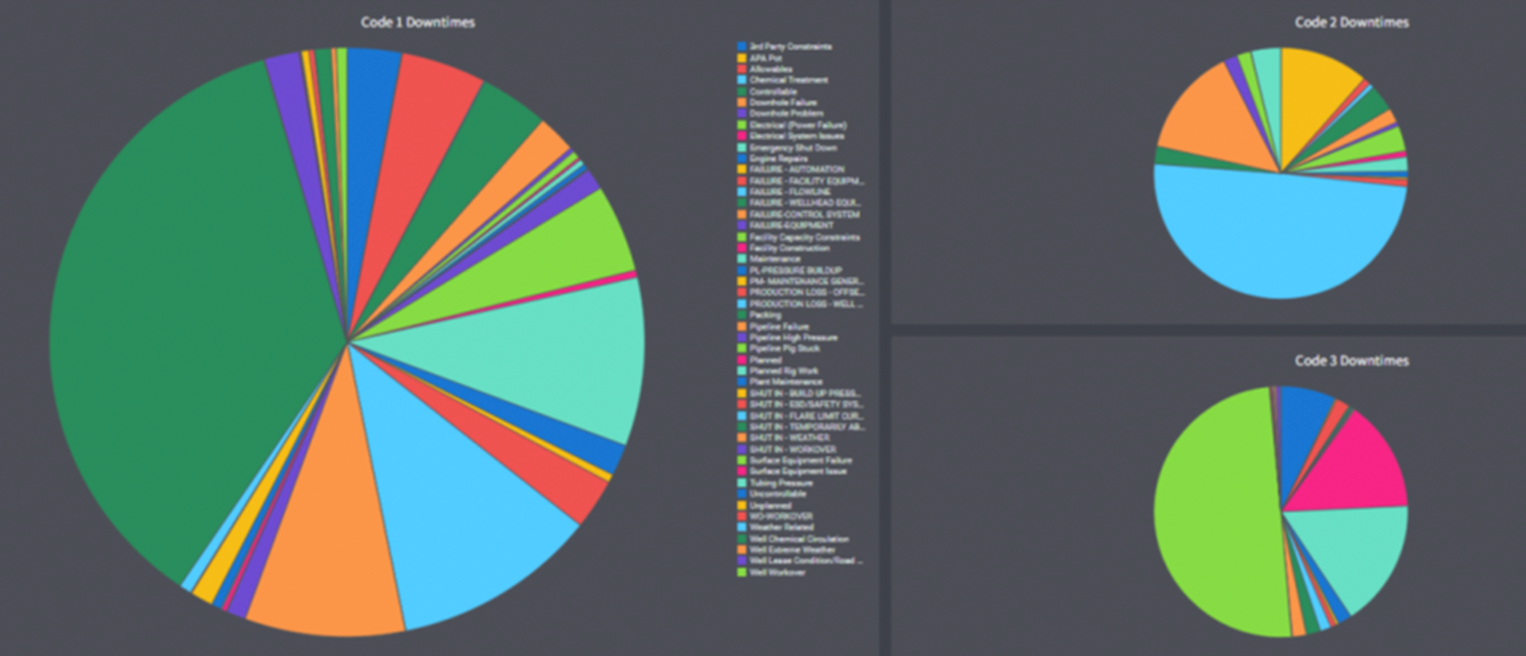
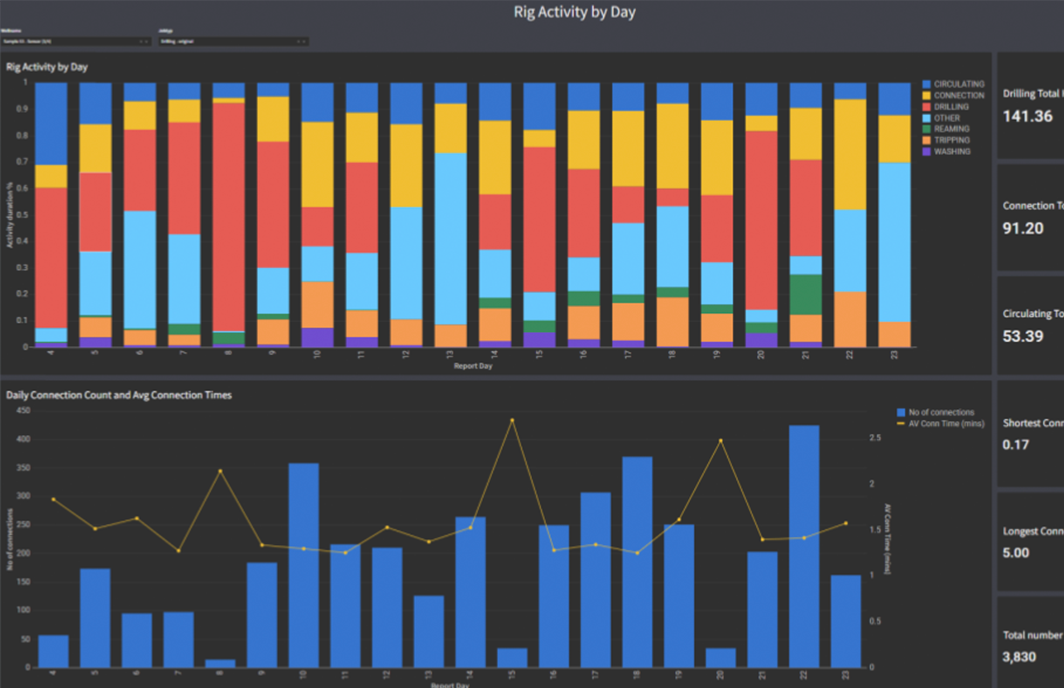
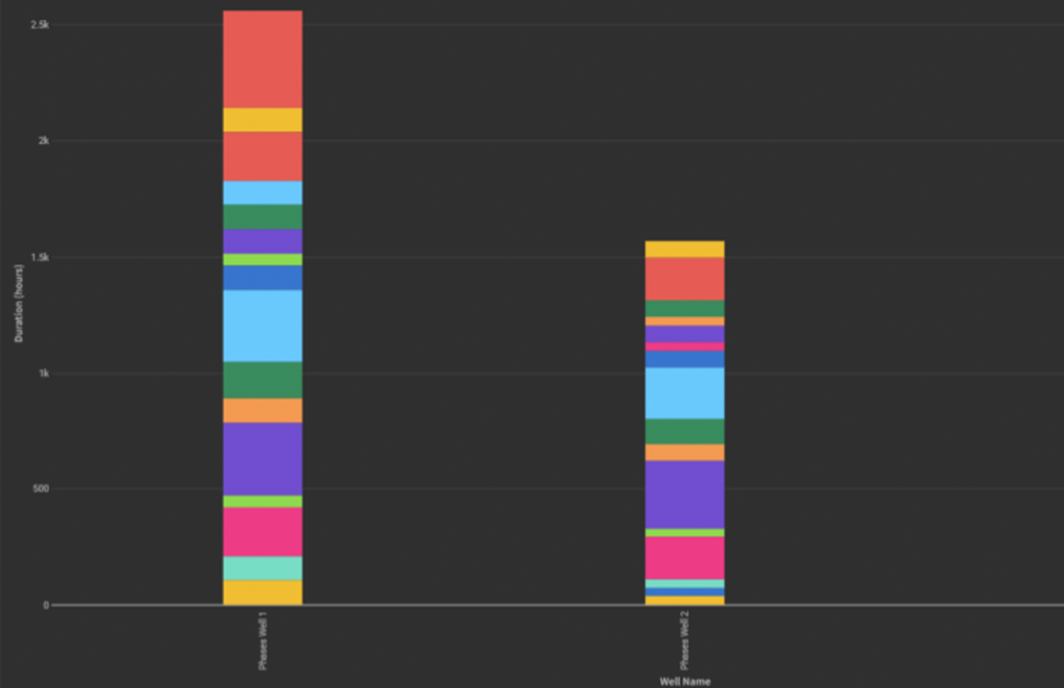
Focus on the Metrics That Matter

Dashboards are designed to surface operational insights, not just data. Users can track KPIs, spot trends, compare performance across wells or assets, and monitor progress against operational targets. With visual tools built for engineers and managers, analysis becomes part of the daily workflow; not an afterthought. 

Request a Demo
KPI Tracking
Monitor key performance indicators across assets, teams, or time periods to support day-to-day operational decisions.
Trend Visualization
Spot anomalies, patterns, and shifts over time with visual tools that bring context to complex operations.
Multi-Well Comparisons
Evaluate performance across wells or regions to identify high performers, outliers, or optimization opportunities.
Target vs. Actual Metrics
Track production, uptime, or efficiency against benchmarks to stay aligned with goals and identify gaps early.
dashboards-icon

Peloton Platform

Peloton Dashboards

Request a Demo

Flexible. Intuitive. Built for Users.

Peloton Dashboards offer a clean, web-based interface for building and viewing dashboards. No coding required. Users can create and update dashboards directly in the browser using drag-and-drop visual tools, with layouts tailored to specific operational roles. The mobile interface ensures field teams stay connected to critical KPIs, while desktop users can dive deeper into multi-well or corporate views. Unlike IT-managed tools, Dashboards are owned and configured by the people who rely on them every day.
Request a Demo
Web-Based Dashboard Builder
Create and edit dashboards directly in your browser, using trusted Peloton ETL data. No coding or external tools required.
Role-Based Layouts
Design dashboards tailored to engineers, field operators, or corporate leaders, ensuring every team sees what matters most.
Mobile-Friendly Design
Access dashboards on the move with a responsive interface optimized for tablets and smartphones.
Self-Serve Configuration
Empower business users to build and manage their own dashboards without relying on IT or development resources.
dashboards-icon

Peloton Platform

Peloton Dashboards

Powered by Peloton ETL

Dashboards are fully integrated within the Peloton Platform, leveraging Peloton ETL to access data from across WellView, SiteView, ProdView, and more. No external connectors or manual data prep required, just seamless access to consistent, trusted platform data in one place. 

Web-Based Dashboard Builder
Create and edit dashboards directly in your browser—no coding or third-party tools required.
Role-Based Layouts
Design dashboards tailored to engineers, field operators, or corporate leaders, ensuring every team sees what matters most.
Mobile-Friendly Design
Access dashboards on the move with a responsive interface optimized for tablets and smartphones.
Self-Serve Configuration
Empower business users to build and manage their own dashboards without relying on IT or development resources.

Looking for more info

Dig Deeper

Hide Info

Looking for less info

Client Testimonials
Peloton delivers robust data capture and reporting across the well lifecycle, backed by top-tier support and a visionary, unified app strategy."
D&C Manager
quote
4 weeks to implement, from kickoff meeting to fully implemented for 2 completions crews for Peloton frac.”
Operations Manager
quote
It was the easiest SaaS migration I’ve ever done. Less than a week. I was able to sleep at night. These guys are the partner I should have gone with from the start for every part of my business.”
D&C Manager
quote
Peloton puts more real-time R&D in their products than any other oil and gas software vendor out there, and I have used a lot of them."
Engineering Technician
quote

EXPLORE THE WELL DATA LIFECYCLE

Request A Demo

Part of the

WELL DATA
LIFECYCLE

wellview-icon-small WellView Allez
WellView Allez Go
Multiple reports, schematics, and timetracks (or any combination) appear side by side. Think of it as your single well dashboard.
site-view SiteView
Allez
SiteView
Allez
Go
Multiple reports, schematics, and timetracks (or any combination) appear side by side. Think of it as your single well dashboard.
siteview-go-icon-color SiteView
Go
SiteView
Go
Go
Multiple reports, schematics, and timetracks (or any combination) appear side by side. Think of it as your single well dashboard.
innova-1 Peloton
 Innova
Peloton
 Innova Go
Multiple reports, schematics, and timetracks (or any combination) appear side by side. Think of it as your single well dashboard.
frac-1 Peloton
Frac
Peloton
Frac
Go
Multiple reports, schematics, and timetracks (or any combination) appear side by side. Think of it as your single well dashboard.
well-integrity Well
Integrity
Well
Integrity
Go
Multiple reports, schematics, and timetracks (or any combination) appear side by side. Think of it as your single well dashboard.