Skip to content
ops-white

Peloton Platform

Peloton Ops

Unify Field Operations in One Platform


Peloton Ops connects drilling, production, and field activities in a centralized system for scheduling, task tracking, and mobile-enabled data capture. Integrated with WellView Allez and ProdView, it eliminates silos and supports compliance. With dashboards, alerts, and push notifications via ProdView Go, it helps teams resolve issues faster and stay aligned across field and office. 

Request A Demo

Part of the

PRODUCTION DATA 
LIFECYCLE

production-icon ProdView
ProdView Go
Multiple reports, schematics, and timetracks (or any combination) appear side by side. Think of it as your single well dashboard.
prod-go-icon-color ProdView

Go
ProdView

Go
Go
Multiple reports, schematics, and timetracks (or any combination) appear side by side. Think of it as your single well dashboard.
drop Peloton

Water
Peloton

Water
Go
Multiple reports, schematics, and timetracks (or any combination) appear side by side. Think of it as your single well dashboard.
ops-logo-1 Peloton
Ops
Peloton
Ops
Go
Multiple reports, schematics, and timetracks (or any combination) appear side by side. Think of it as your single well dashboard.

Centralized Oversight for

Field Operations

From production targets to ESG tracking, Peloton Ops centralizes alerts, dashboards, and priorities in one shared workspace.

One Workspace.
Full Operational Visibility.

ops-dashboard-1
Tablet (1)
software-img
Mobile
software-img
impact analysis
Deferment Tracking &
Impact Analysis

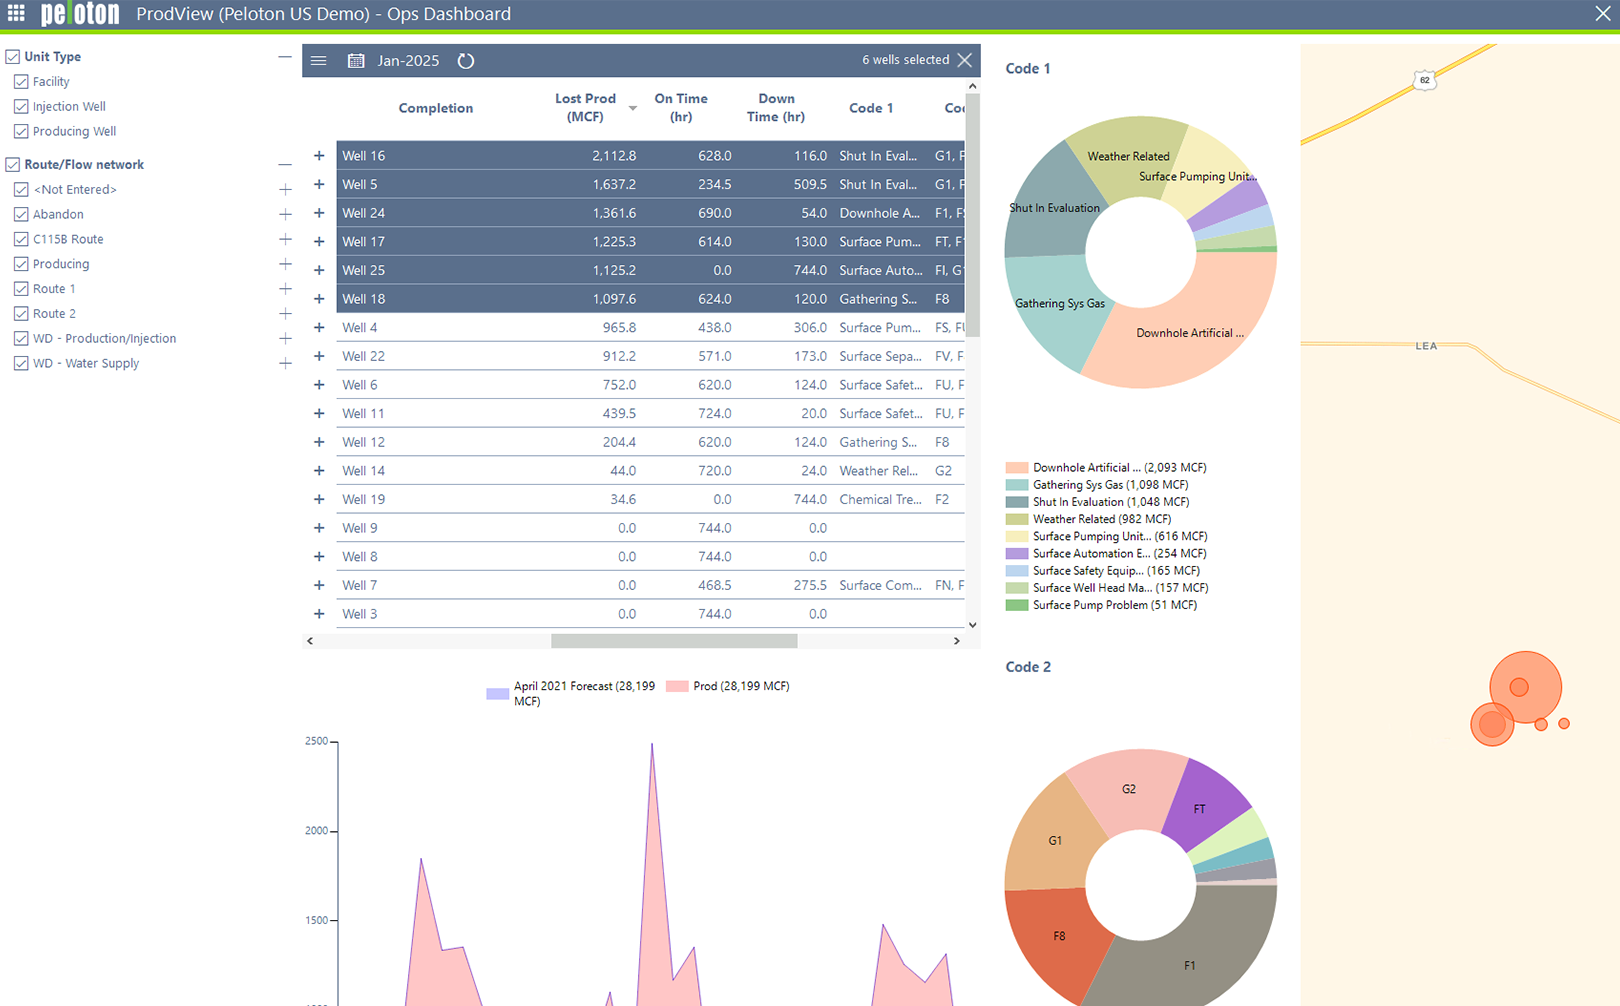
Quantify lost production, identify trends, and trace underperformance to specific events or workflows directly from the Deferments Dashboard.

Know What’s Missing. Act on What Matters.

field-comm
Dynamic Task
Scheduling & Tracking

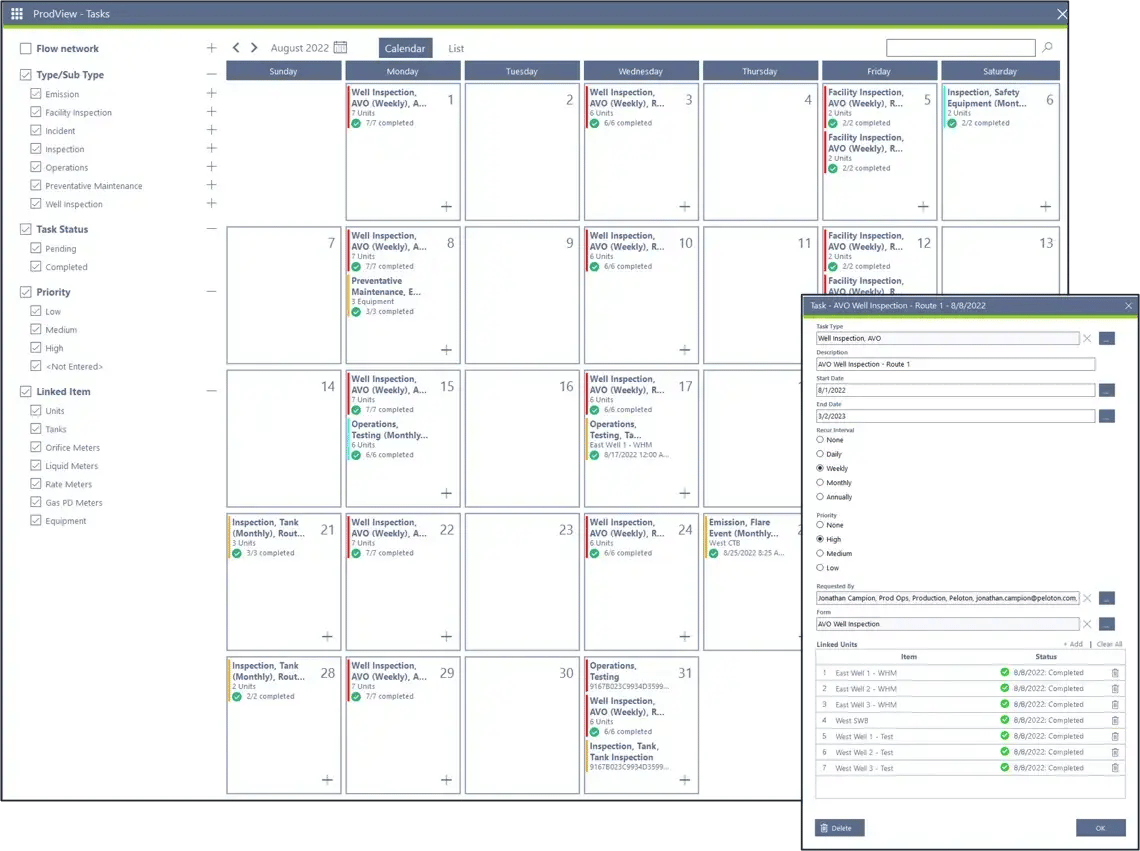
Use the Tasks Visualizer to assign, schedule, and complete inspections, maintenance, and compliance activities—organized by day, asset, or priority.

Assign It. Track It. Close It.

emissions-1
Integrated
Emissions Tracking

Monitor fuel, flare, and vent usage across field activities—calculated using data from WellView Allez and ProdView. 

Track Emissions. Meet Your Targets.

No-code
Custom
No-Code Forms

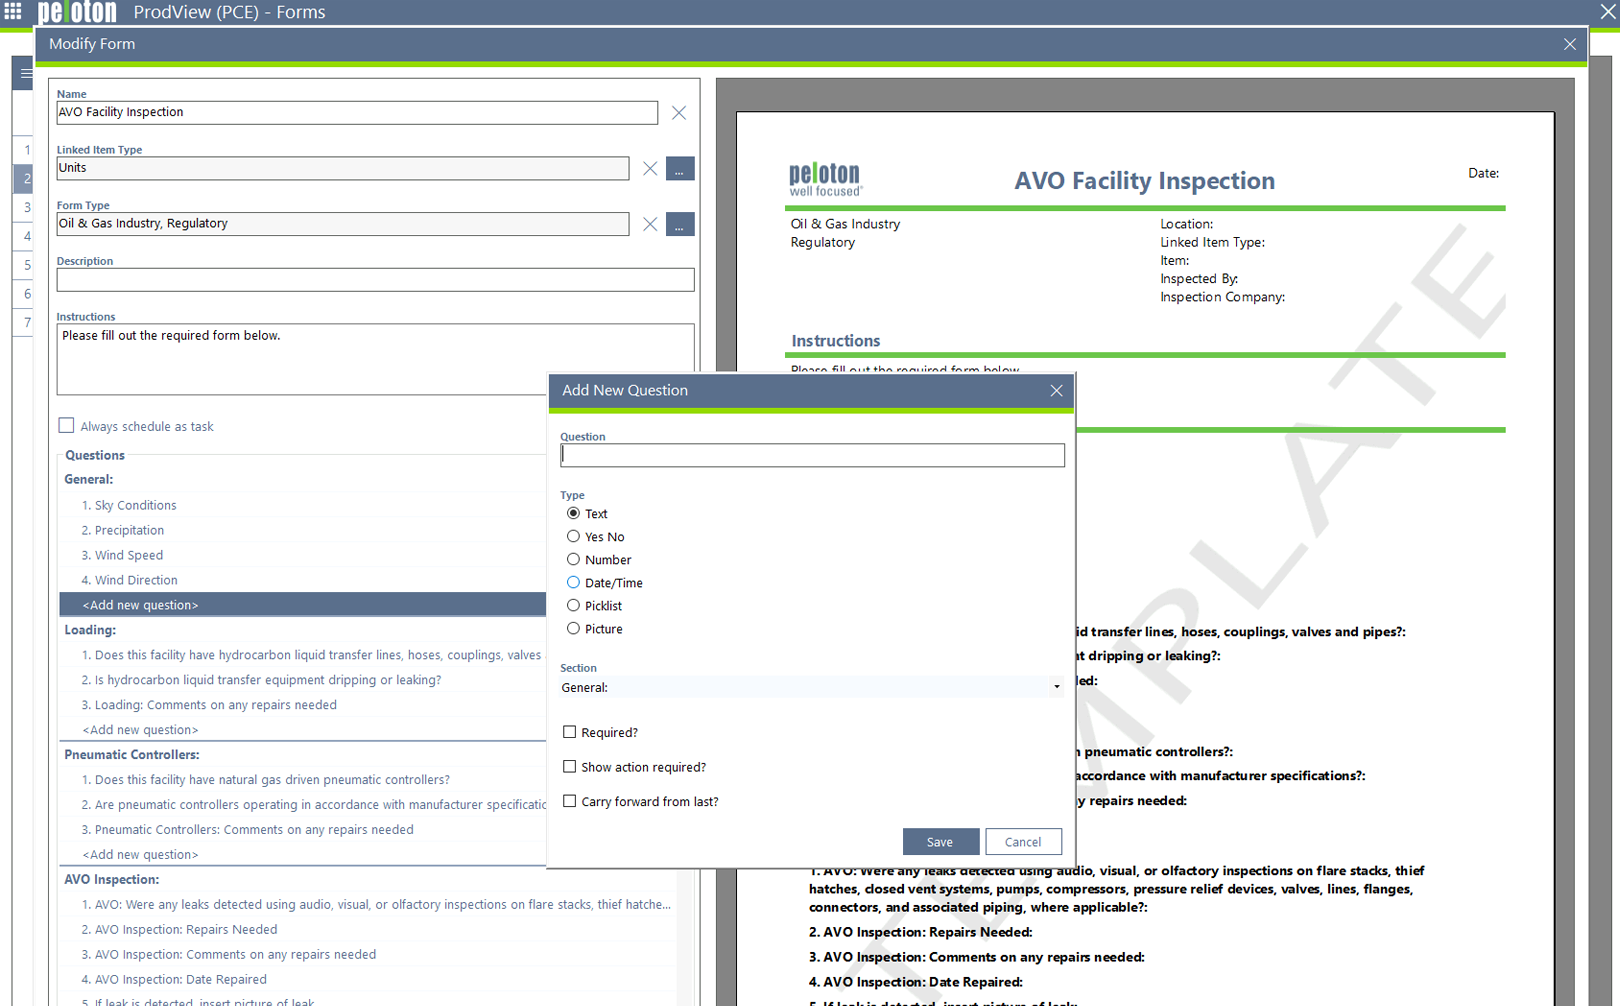
Build and manage operational, environmental, or safety forms without IT support. Capture field data consistently and integrate it into reporting workflows.

Form What You Need. Report What Matters.

ops-v2
Interactive
Asset Mapping

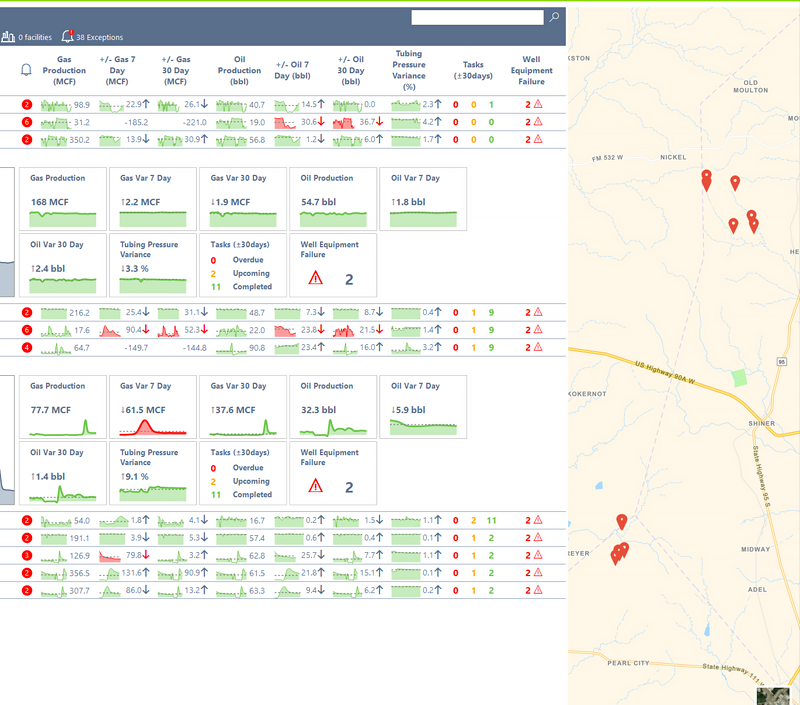
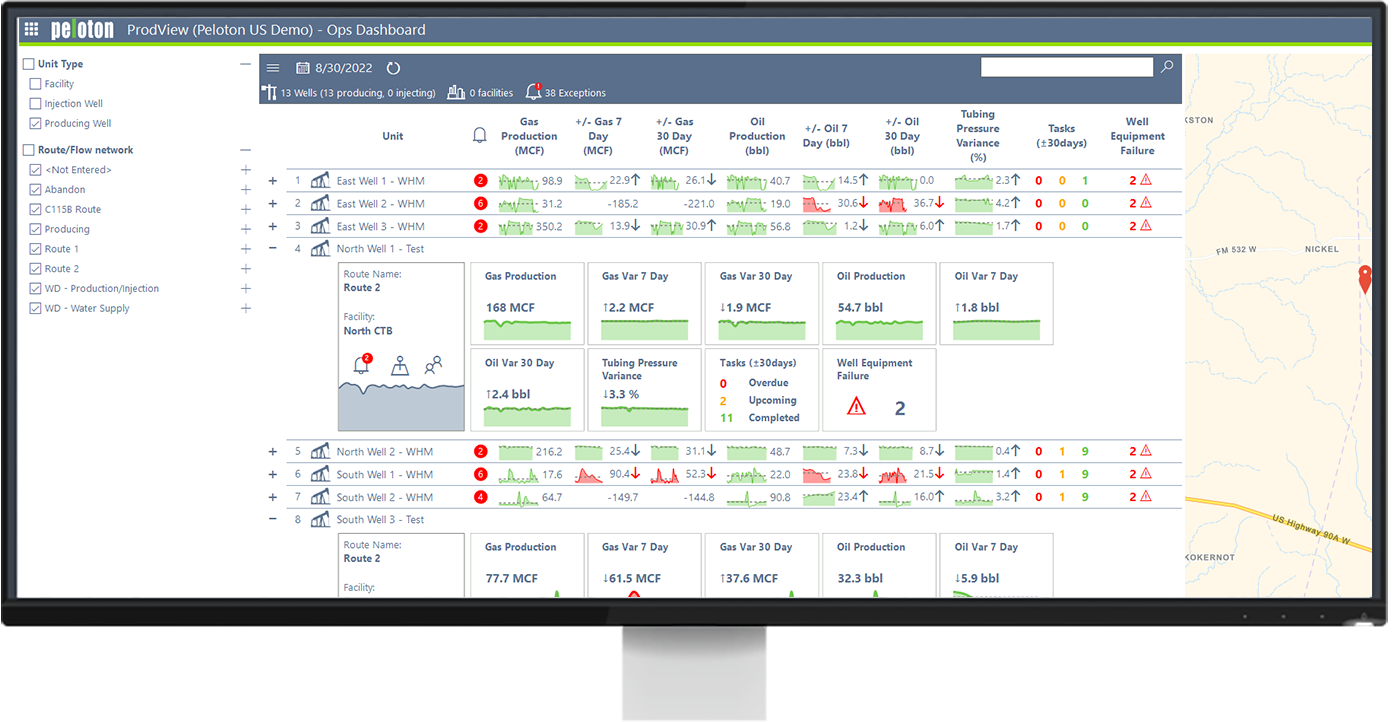
Visualize assets by location, task status, or performance conditions with map-based filters and dashboard links.

See the Field. Direct the Action.

Request a Demo
ops-logo-1

Peloton Platform

Peloton Ops

Request a Demo

Designed for Real-World Field Impact

Peloton Ops is purpose-built for field teams, giving them the visibility, task control, and compliance tools they need to act quickly and work with confidence. At the center is a configurable form engine that powers everything from inspections and maintenance to ESG and regulatory workflows, without requiring IT support. 

Request a Demo
Platform Integration with WellView Allez & ProdView
Operate from a single environment with shared data between WellView Allez, ProdView, and Operations Center. 
Scalable Form Engine
Design and manage thousands of operational, safety, or compliance forms with no-code configuration and conditional logic.
Deferment & Exception Tracking
Identify and quantify production losses, missed targets, and high-impact operational issues.
Mobile-Enabled Field Execution
Deliver tasks, alerts, and forms directly to field personnel using ProdView Go. Operators can complete work offline and automatically sync data when connectivity is restored. 
Teamwide Collaboration
Share progress, reassign tasks, and surface status updates across departments to close the loop between field and office.
Task Visualizer
Organize and execute work using calendar, list, or asset-based task views.

Less Guesswork, More Control. 

Peloton Ops turns structured task management and data capture into measurable results, helping teams stay proactive, productive, and prepared. 

Schedule and oversee recurring tasks like inspections and maintenance with structured workflows.
Detect issues using rule-based thresholds for deferments, missed tasks, or compliance gaps.
Capture environmental data in context and streamline jurisdiction-specific reporting.
Monitor operational status, alerts, and deferments across assets and teams from a central view.
Configure once and deploy across any business unit, region, or operation.
Validate and audit incoming data for completeness, accuracy, and compliance readiness.
Connect with WellView Allez, ProdView, Peloton Map, and SCADA/IoT feeds to align field data, alerts, and activities in one shared workspace.
ops-logo-1 1

Peloton Platform

Peloton Ops

Request a Demo

Insights That Move Operations Forward

Peloton Ops turns unstructured field inputs and real-time system data into clear, actionable analysis.

Request a Demo
Deferments Visualizer
Toggle between dashboards to quantify production losses by downtime code, deferred targets, or root cause. Built-in charts and heat maps simplify pattern recognition and prioritization.
Operational Dashboards
Flag threshold breaches and surface intervention opportunities using real-time field metrics synced from ProdView and WellView Allez.
Emission Tracking Tools
Analyze fuel, flare, and vent data across multiple metrics, including methane intensity or CO₂ equivalents, with built-in bubble maps and ranking tools.
Form-Based Reporting
Capture granular field details in structured form entries that support trend analysis, compliance documentation, and root-cause insights.
Exception Management
Monitor anomalies in task execution, emissions, and production using rule-based triggers and alert settings.
Data Integrity Controls
Review completed forms and task logs for audit-readiness, with full traceability from field input to dashboard view.
ops-logo-1

Peloton Platform

Peloton Ops

Request a Demo

Built for Action—from Dashboard to Field

Peloton Ops delivers a highly configurable user experience designed to prioritize the right tasks, escalate issues, and simplify execution across teams.

Request a Demo
Custom Dashboards
Engineers and operations staff can personalize their view by ranking assets, setting alert thresholds, and filtering key variables for fast decision-making.
Task Visualizer
Organize tasks by asset, priority, or calendar view—then track progress and completion status in real time.
Interactive Maps
Visualize asset health, emissions hotspots, or task status using dynamic bubble and satellite maps.
Field-Connected UI
Push tasks, alerts, and forms directly to the field via ProdView Go, ensuring mobile users always have what they need—even offline.
No-Code Forms Center
Easily create and manage operational, safety, and ESG forms using flexible input types and drag-and-drop configuration.
Multi-Level Admin Tools
Customize user roles, task recurrence settings, and help documentation access through built-in admin views.
ops-logo-1

Peloton Platform

Peloton Ops

Request a Demo

Seamlessly Connected Across the Platform

Peloton Ops is tightly integrated with WellView Allez, ProdView, and third-party systems to support consistent, cross-functional operations.

Request a Demo
Native Peloton Integration
Share Jobs, Problems, and Well Header data directly from WellView Allez. Sync field tasks, emissions, and production events across ProdView and Ops Center in real time.
Third-Party Compatibility
Leverage predefined formats or RESTful Web APIs to exchange data with external software, including SCADA, gas editors, and partner systems.
SCADA & IoT Feeds
Automate data ingestion from connected field devices—no manual re-entry required.
ETL for Analytics & Reporting
Feed ProdView data into Spotfire, Tableau, Power BI, or external databases using Peloton’s ETL service.
Admin-Friendly Tools
Use Task Manager to configure and monitor integrations, including scheduled tasks, imports, and system health.
Bulk Load & Export Options
Upload network configurations, historical well data, and partner files in bulk. Export charts and reports to Excel, Word, or PDF in one click.

Looking for more info

Dig Deeper

Hide Info

Looking for less info

Client Testimonials
It was the easiest SaaS migration I’ve ever done. Less than a week. I was able to sleep at night. These guys are the partner I should have gone with from the start for every part of my business.”
D&C Manager
quote
Peloton puts more real-time R&D in their products than any other oil and gas software vendor out there, and I have used a lot of them."
Engineering Technician
quote
Peloton delivers robust data capture and reporting across the well lifecycle, backed by top-tier support and a visionary, unified app strategy."
D&C Manager
quote

EXPLORE THE PRODUCTION DATA LIFECYCLE

Request A Demo

Part of the

PRODUCTION DATA LIFECYCLE

Group 1502 1 ProdView
ProdView Go
Multiple reports, schematics, and timetracks (or any combination) appear side by side. Think of it as your single well dashboard.
prod-go-icon-color ProdView
Go
ProdView
Go
Go
Multiple reports, schematics, and timetracks (or any combination) appear side by side. Think of it as your single well dashboard.
drop Peloton
 Water
Peloton
 Water Go
Multiple reports, schematics, and timetracks (or any combination) appear side by side. Think of it as your single well dashboard.
ops-logo-1 Peloton
 Ops
Peloton
 Ops Go
Multiple reports, schematics, and timetracks (or any combination) appear side by side. Think of it as your single well dashboard.