
%20(1)%201%201-1.svg)

.png?width=516&height=545&name=Tablet%20(1).png)
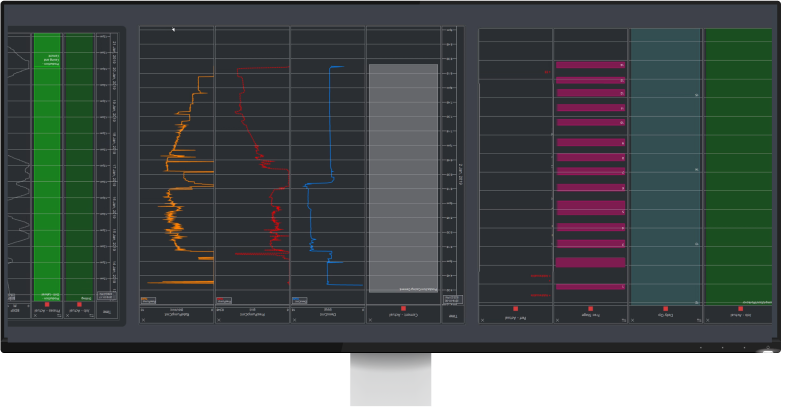

Automatically load drilling and completions data at the source to reduce manual work, improve accuracy, and accelerate reporting workflows. Built-in validation ensures clean, trusted data from field to office.
Validated at the Source. Ready for Reporting.
Peloton Platform
WellView Allez
What Sets WellView Allez Apart
WellView Allez is more than a reporting tool—it’s a trusted well operations platform used by over 70% of the industry. Designed for operational reliability, configurable to diverse workflows, and backed by validated data, it gives teams the confidence to plan, operate, and scale with clarity.
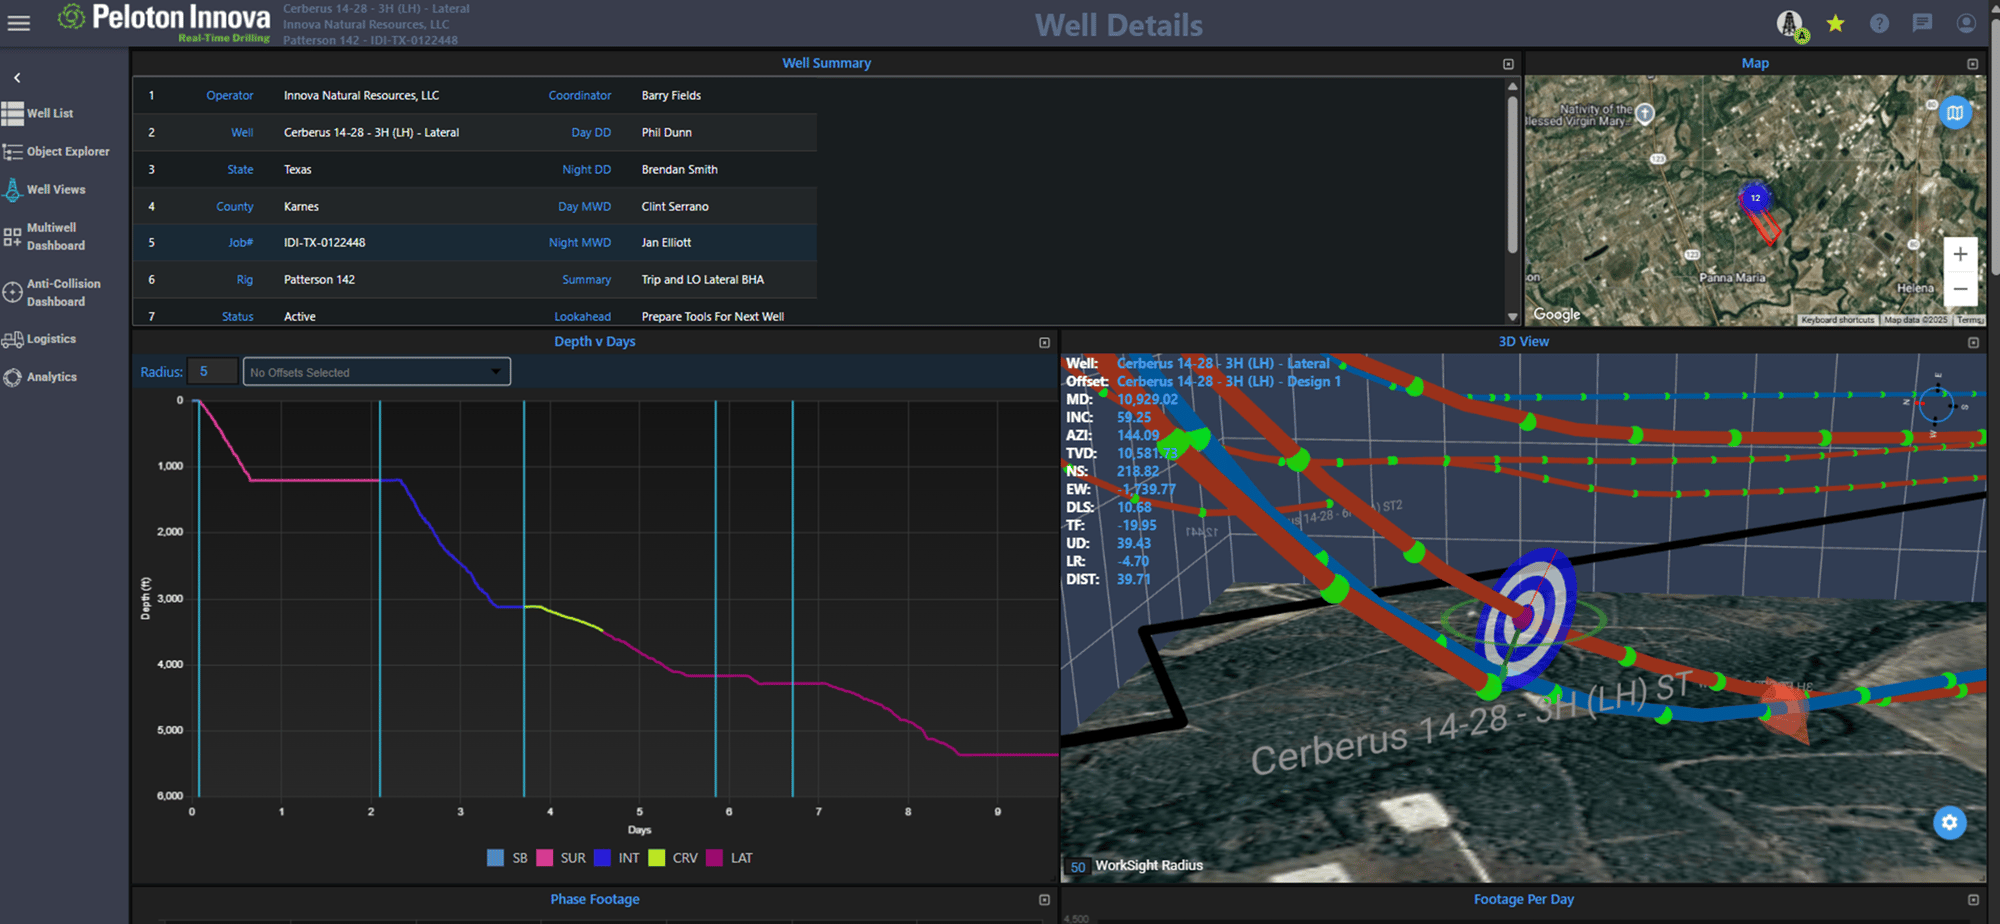
Turn Complex Operations into Confident Decisions
WellView Allez brings clarity to every phase of the well lifecycle by organizing your data, streamlining reporting, and giving your team the insights they need to act fast and smart.
Peloton Platform
WellView Allez
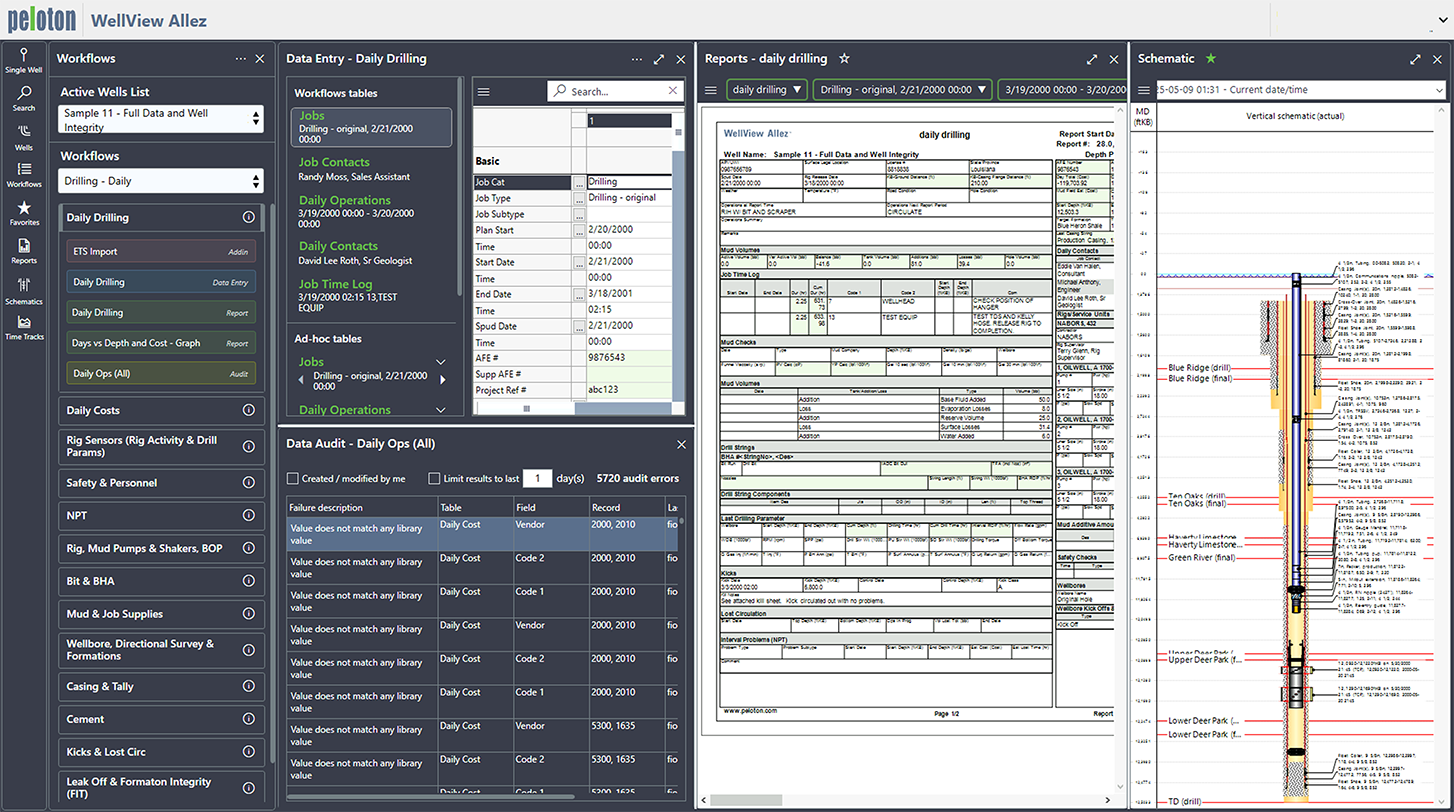
See the Whole Picture: Past and Present
With WellView Allez, your well data becomes a valuable resource, not just a record. Access 30+ years of structured data, trend reports, and cost tracking to support smarter decisions, from the field to the boardroom.
Peloton Platform
WellView Allez
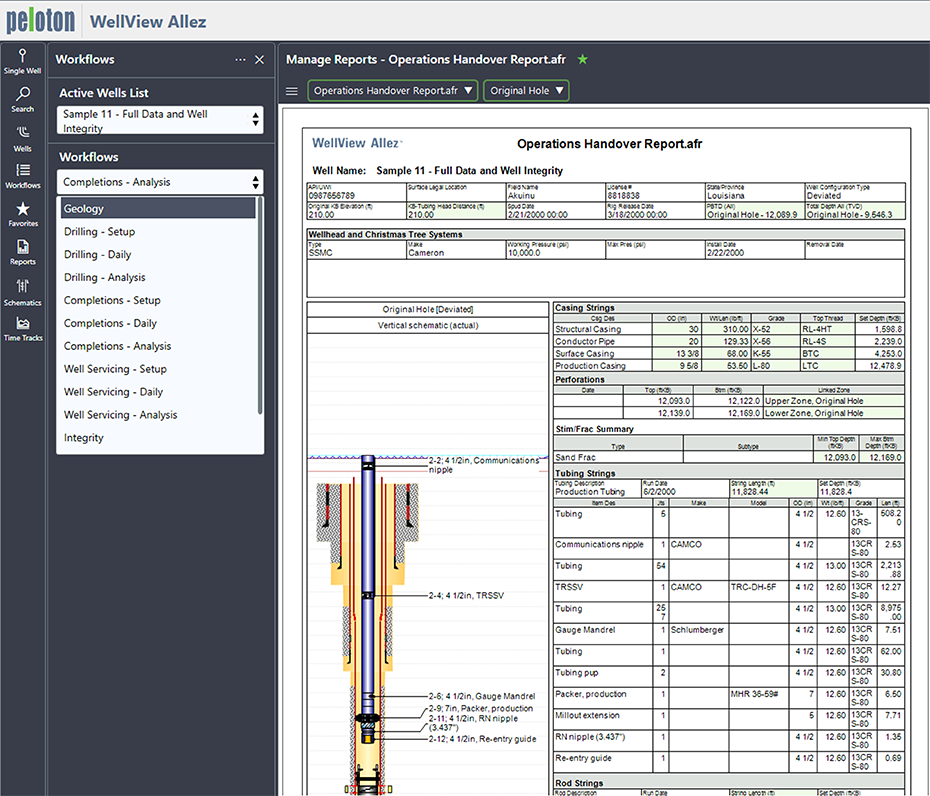
A Solution You’ll Actually Use
WellView Allez was built for the way energy teams work today. Its user-friendly interface brings the well lifecycle into focus, with fast navigation, synced updates, and interactive views that make complex data easier to manage.
Peloton Platform