
.png?width=516&height=545&name=Tablet%20(1).png)

Stay aligned with linked updates across RigView and WellView, so everyone works from the same schedule.
One Schedule. Shared Oversight.
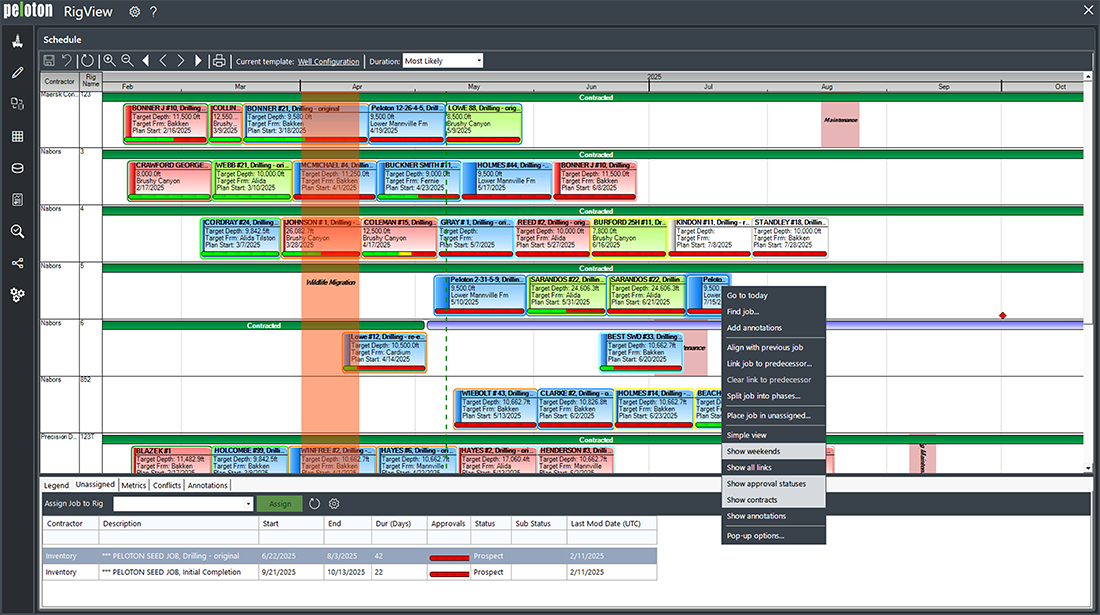
Explore changes and adjust schedules with drag-and-drop tools designed for fast decisions.
Plan Ahead. Stay Flexible.
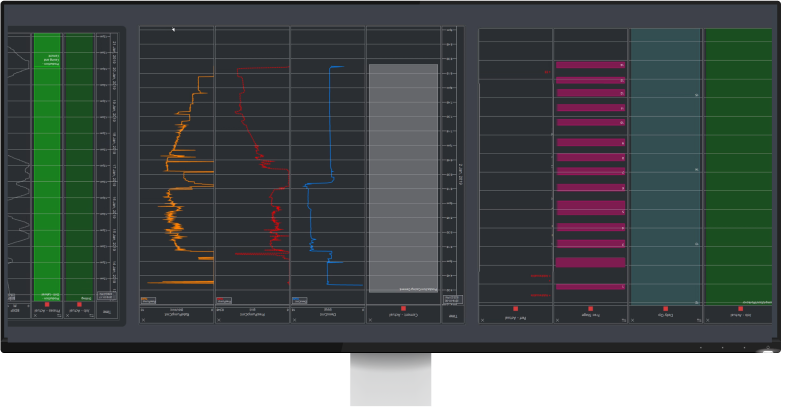
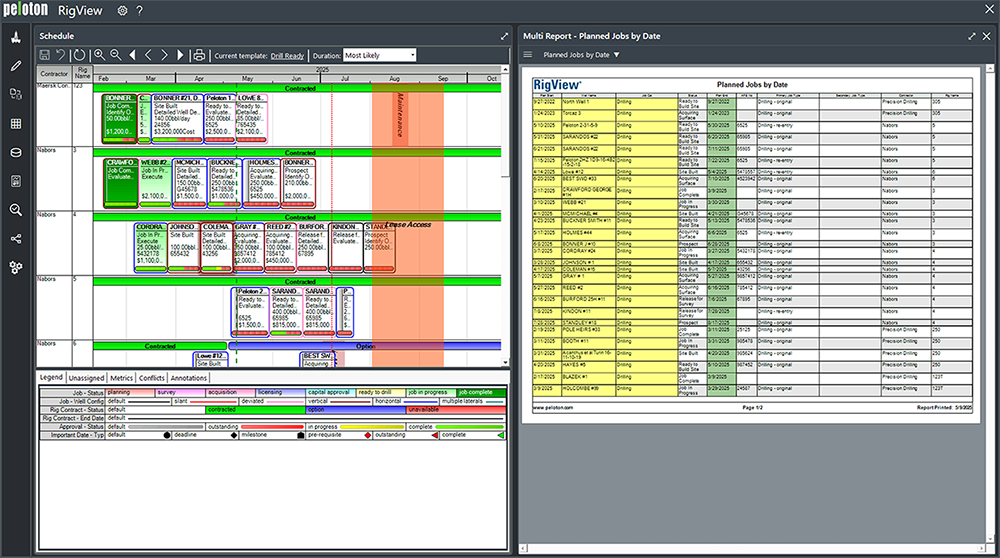
Drag-and-drop calendars, Gantt charts, and map views give teams a fast, intuitive way to manage rig activity. All fully integrated with Peloton lifecycle data.
Interactive Tools. Smarter Decisions.
Track rig utilization and performance over time to identify scheduling gaps, optimize usage, and strengthen accountability across teams and vendors.
Schedule Insight. Smarter Use.

Peloton Platform
RigView
What Sets RigView Apart
RigView simplifies complex scheduling across the well lifecycle helping teams coordinate rig activity, resolve conflicts, and align operations through built-in logic, visual tools, and Peloton Platform integration.
Smarter Scheduling, Every Day
RigView helps operations teams reduce downtime, prevent scheduling errors, and manage activity across assets with confidence.
Peloton Platform
RigView
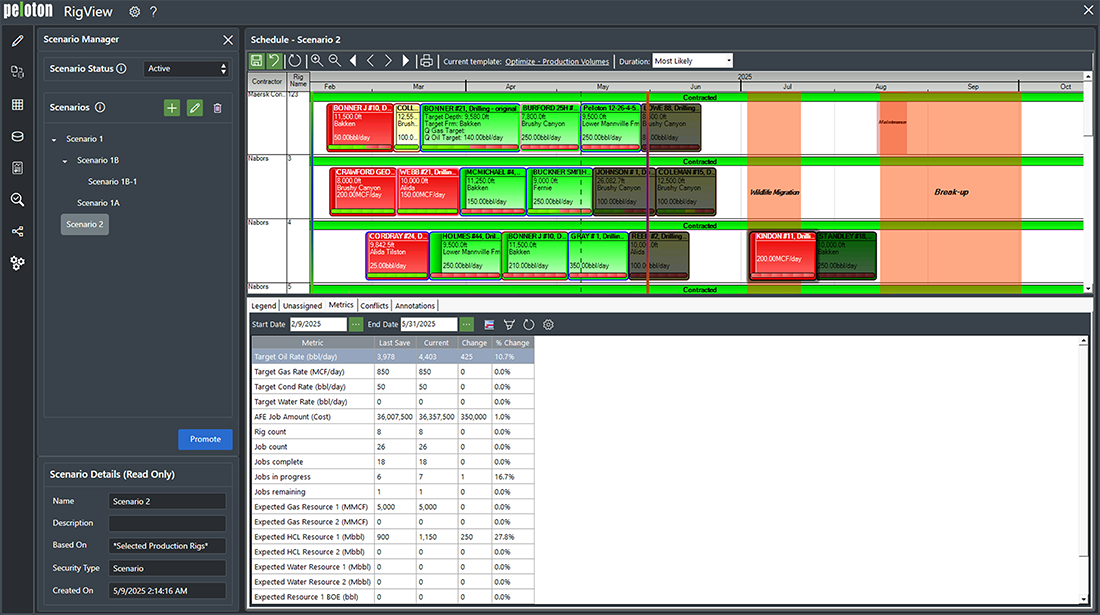
Smarter Scheduling Starts with Better Data
RigView gives your teams the insight to go beyond task management, turning scheduling data into operational strategy, budget confidence, and continuous improvement.
Peloton Platform
RigView
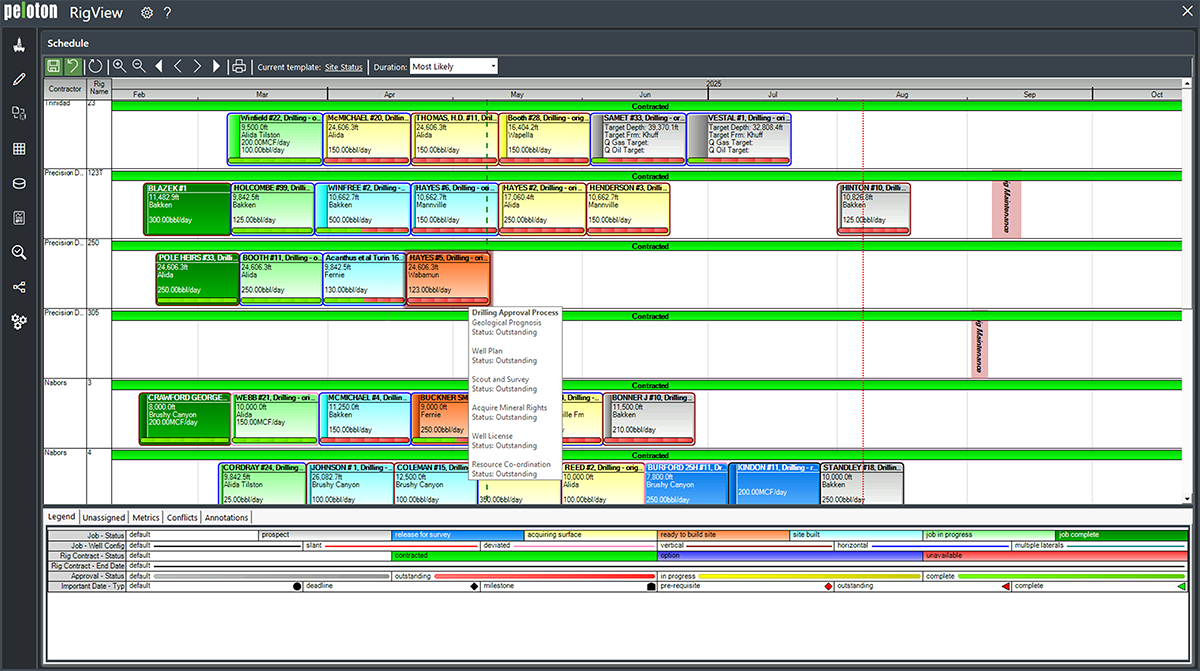
A Visual Scheduling Interface That Works the Way You Do
RigView simplifies rig scheduling with intuitive drag-and-drop tools, helping teams coordinate activity, respond to changes, and keep projects moving.
Peloton Platform
RigView
Connected from Planning to Execution
RigView integrates with Peloton applications and enterprise systems, helping teams align rig schedules with well planning, site activity, and reporting workflows.