Skip to content
peloton-map

Peloton Platform

Peloton Map

Visualize Your Energy Data

Peloton Map is the mapping app for the Peloton Platform. Built specifically to help you spatially interact with your land data. With Esri GIS technology, custom layers, and contextual navigation, it connects your operations with spatial intelligence—no duplication required.

Request A Demo

Part of

LAND DATA MANAGEMENT

land-icon-1 LandView
LandView Go
Multiple reports, schematics, and timetracks (or any combination) appear side by side. Think of it as your single well dashboard.
land-icon-2 Peloton

Map
Peloton

Map
Go
Multiple reports, schematics, and timetracks (or any combination) appear side by side. Think of it as your single well dashboard.
broker-icon-1 Peloton
Broker
Peloton
Broker
Go
Multiple reports, schematics, and timetracks (or any combination) appear side by side. Think of it as your single well dashboard.

Live Mapping

Connected Operations

Seamlessly integrated with LandView to display your agreements, wells, and facilities with live, bi-directional interactivity. Easily map stakeholders and crossings, and generate dynamic line lists for complete operational context. 

One Map.
Full Context.

Frame
Tablet (1)
software-img
Mobile
software-img
Automatic-Spatial-Updates-1
Automatic
Spatial Updates

Say goodbye to manual updates. As records change in LandView, Peloton Map updates automatically, improving accuracy.

Always Current. No Manual Mapping.

Cross-Application-Navigation-1
Cross-Application
Navigation

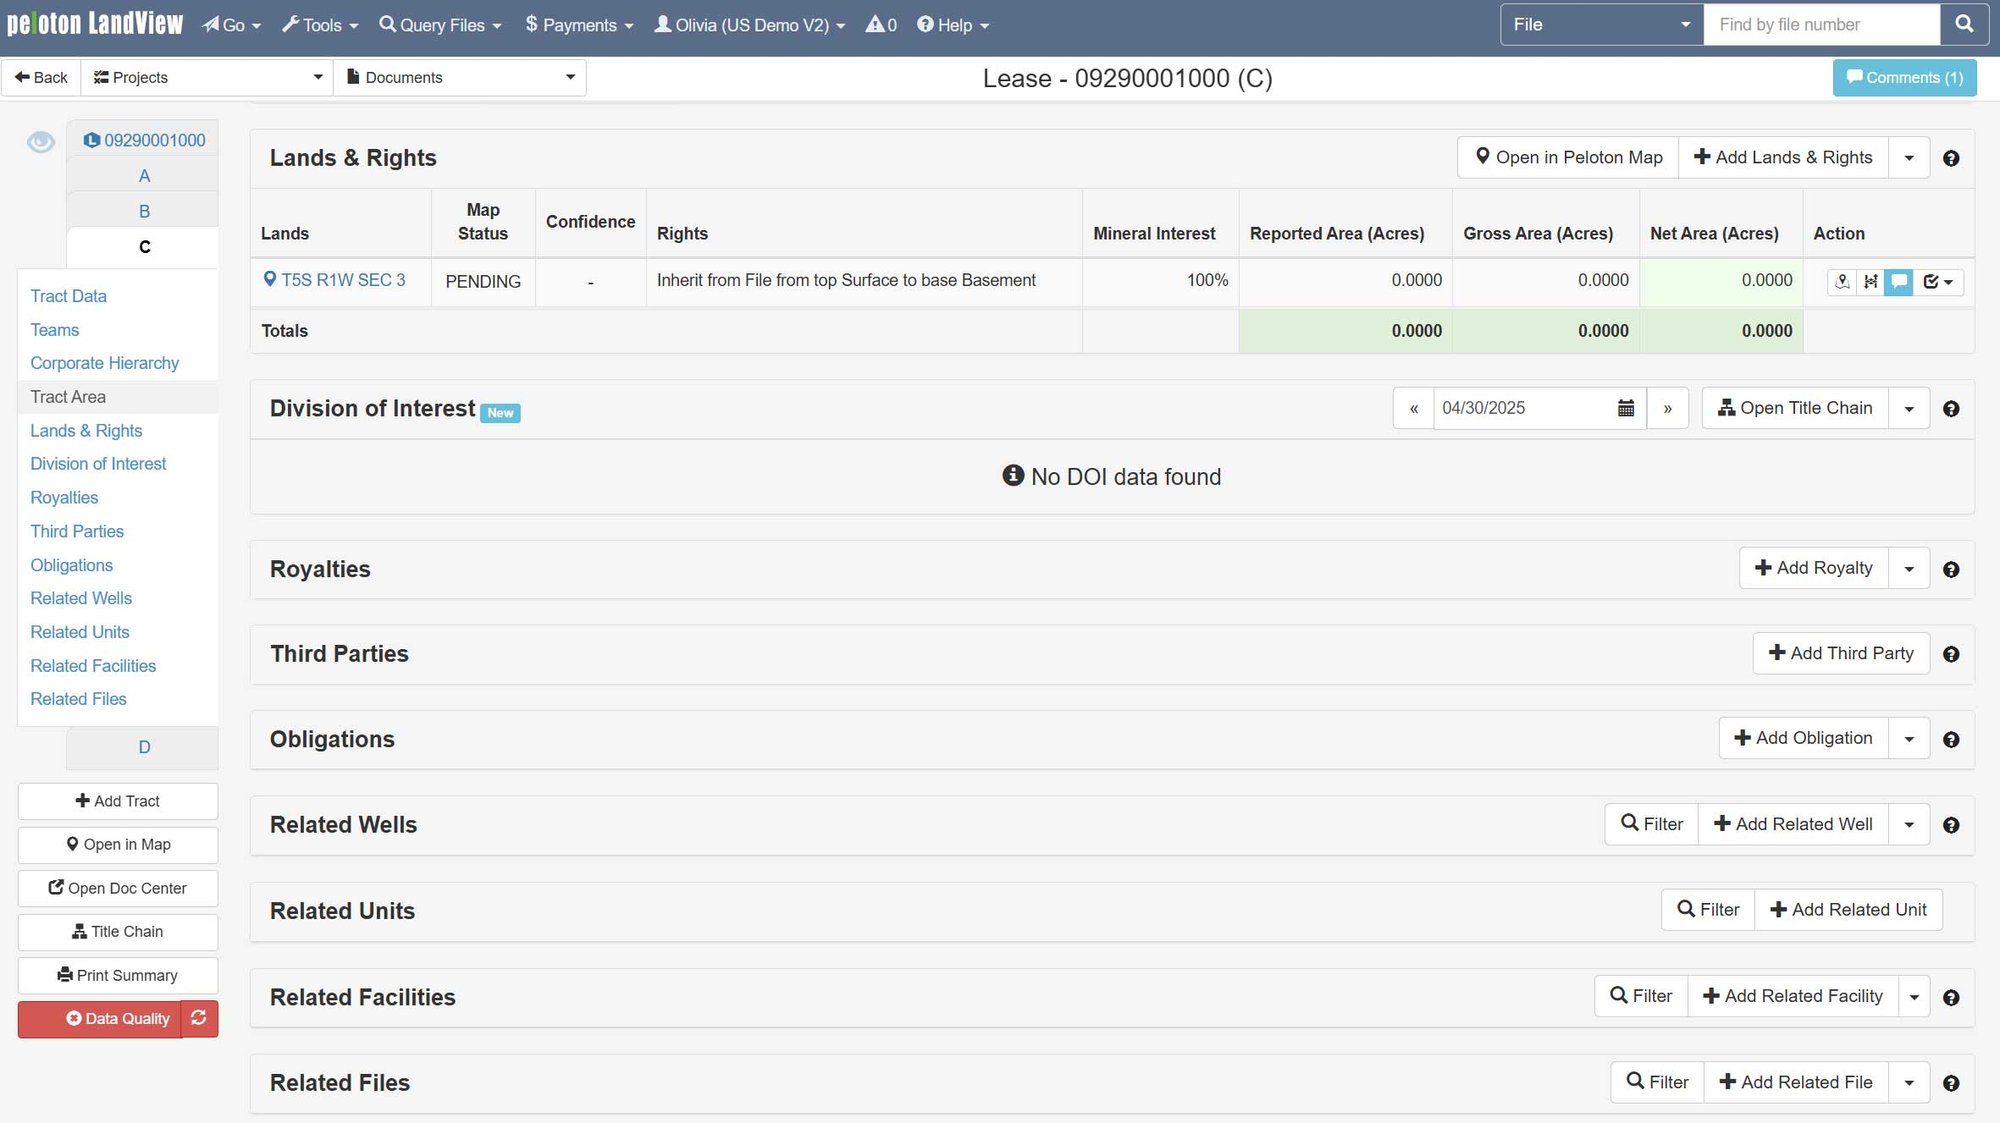
Drill into details with info cards, data pop-ups, or the tabular view for quick access within the map. Hyperlink directly to LandView agreements for complete, detailed information.

From App to Map and Back Again.

targeted queries
Better Insight Through
Targeted Queries

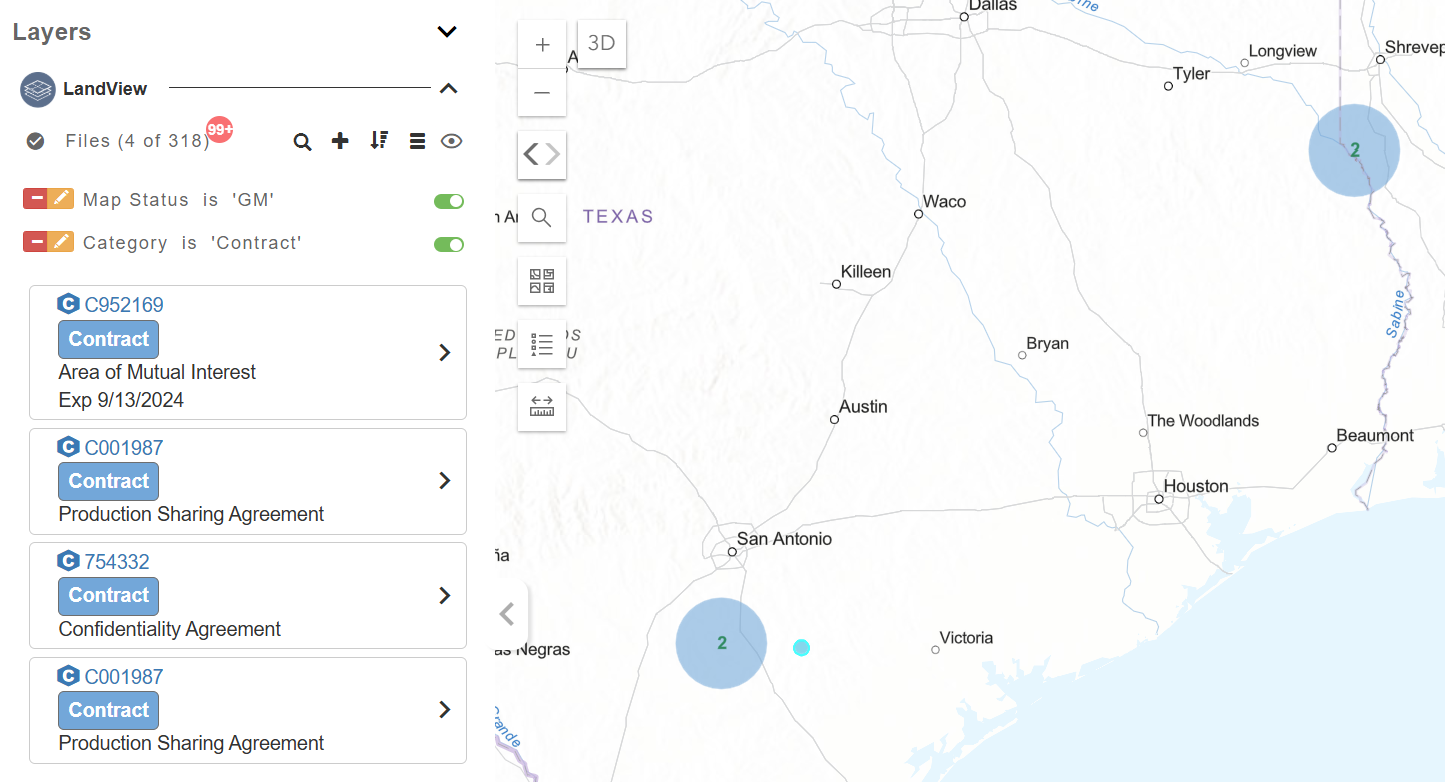
Highlight obligations, lease areas, or well activity using flexible filters and spatial queries.

Smarter Filters. Clearer Priorities.

Layered-Spatial-Intelligence
Layered
Spatial Intelligence

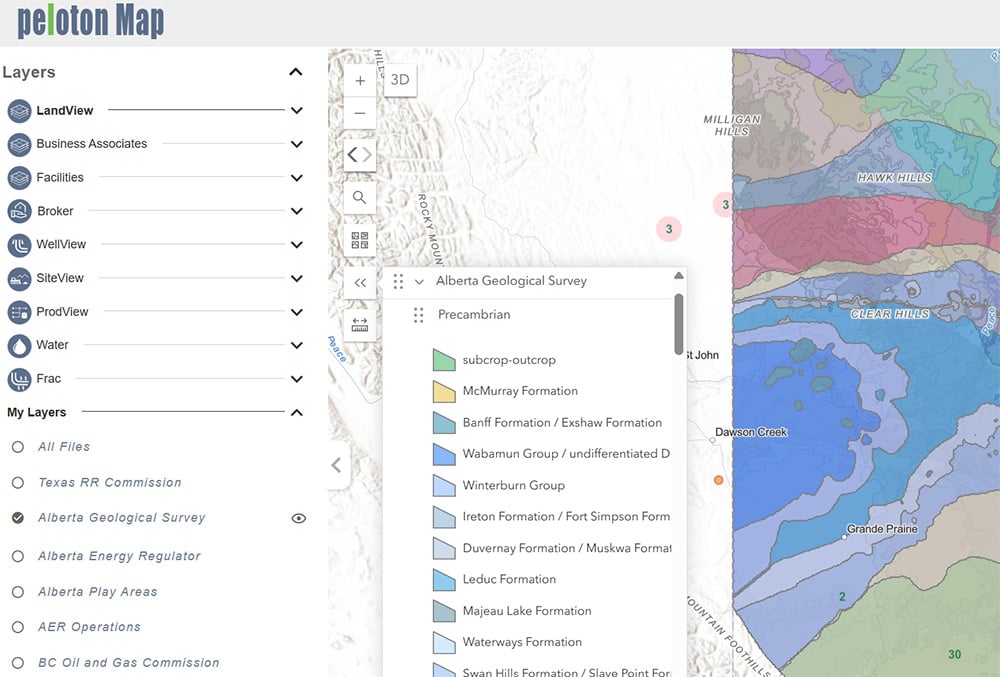
Overlay Peloton data with regulatory, environmental, or third-party sources to get the full picture. Use geospatial information for linear projects to support midstream, renewables and transmission operations.

Unified Layers. Sharper Context.

Request A Demo
peloton-map

Peloton Platform

Peloton Map

Request a Demo

What Sets Peloton Map Apart

Peloton Map isn’t just a mapping add-on, it’s a core part of the Peloton Platform, purpose-built to unify spatial data with operational workflows.

Request a Demo
Platform Integration, Built-In
Out-of-the-box mapping is available starting with LandView, with built-in links across applications for a connected experience.
Automated Spatial Updates
Legal descriptions entered in LandView automatically generate maps—no manual GIS work needed. The same applies to address-based stakeholder visualization.
ArcGIS Compatibility

Built on Esri’s trusted framework to support existing GIS tools and workflows.

Custom Queries & Visual Filters
Create spatial queries to visualize assets, track obligations, and support planning.
Layered Spatial Context
Combine Peloton data with third-party layers for deeper operational awareness.
Cross-Application Navigation
Move between the map and applications like LandView with a single click, preserving context and saving time across workflows.

Spatial Intelligence Made Simple

Peloton Map transforms spatial data into operational insight, helping teams plan, monitor, and execute with precision. 


View lease boundaries, well sites, and infrastructure layouts all in one place.
Save areas of interest, toggle map layers, and tailor views to project needs.
Zoom into map areas and extract lists or images for analysis and communication.
Use Peloton Map on desktop, laptop, or mobile, no specialized setup required.
From land departments to drilling engineers, Map supports multi-role collaboration and spatial awareness.
peloton-map

Peloton Platform

Peloton Map

Request a Demo

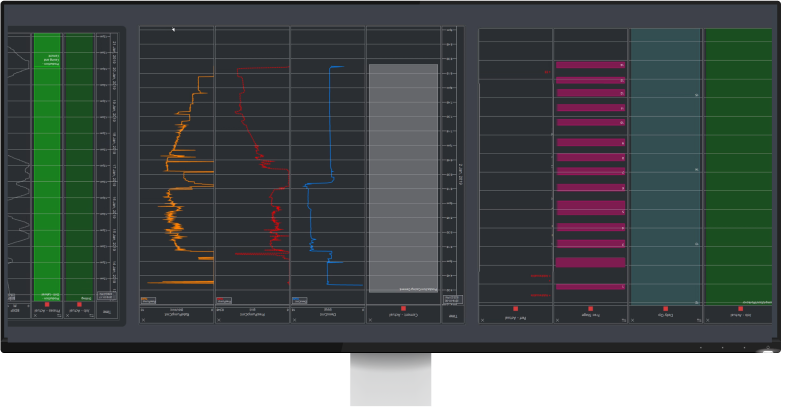
See the Shape of Your Operations

Peloton Map empowers teams to analyze spatial data directly in the interface—visualizing what’s happening, where, and why. From acreage comparisons to prospect-level summaries, Peloton Map connects visual context with operational insight, helping you identify patterns, validate data accuracy, and support better planning decisions. No exports or external systems required to get started. 

Request a Demo
Graphical Displays
View charts and activity breakdowns tied to mapped records from LandView or SiteView Allez.
CSV Export
Generate spreadsheets from selected map areas when deeper analysis or documentation is needed.
Confidence Comparisons
Compare mapped acreage with recorded values to flag discrepancies or validate accuracy.
Prospect-Based Summaries
Run spatial queries by prospect to visualize lease obligations, surface rights, and permit coverage.
Overlay-Driven Insights
Layer environmental boundaries, jurisdictional zones, or competitor wells to enhance local analysis.
Map-to-Action Auditing
Quickly identify mismatches between mapped locations and operational records—before they impact reporting.
peloton-map

Peloton Platform

Peloton Map

Request a Demo

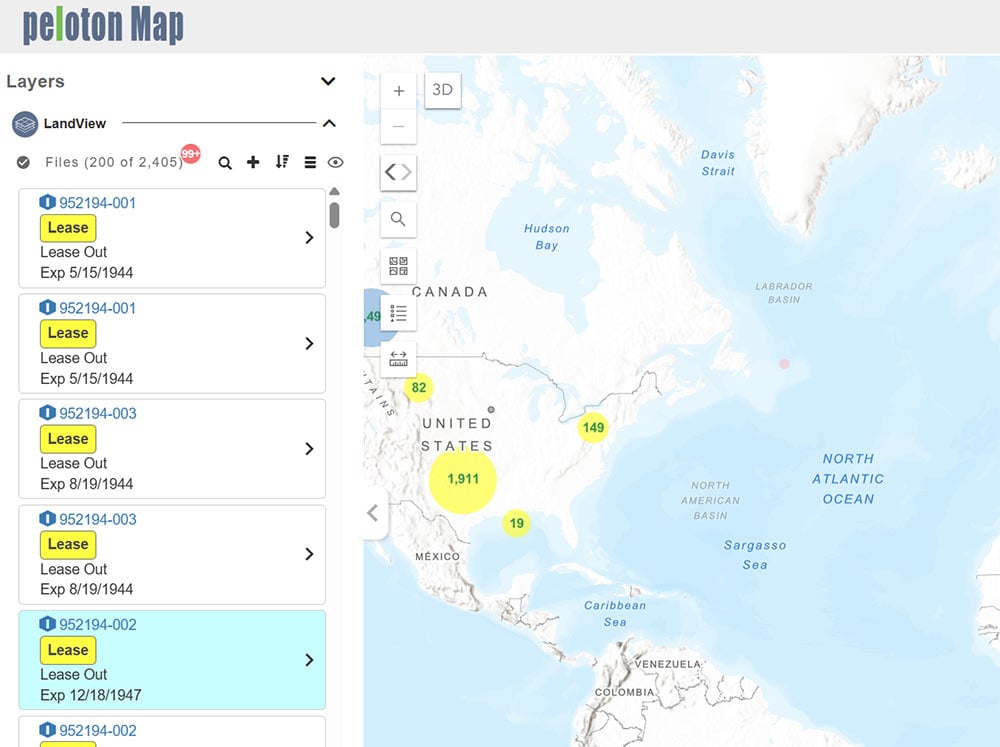
Designed for Daily Decisions

Peloton Map delivers a clean, modern interface built for operational clarity. Whether you’re reviewing lease boundaries, tracking wells, or planning infrastructure, the intuitive layout makes it easy to explore, filter, and act on spatial data. No GIS expertise required. With direct links to Peloton applications and layered visualization tools, your team gets the full picture, faster. 

Request a Demo
Modern Mapping Interface
Navigate spatial data with simple zoom and pan controls—or jump to an asset from a linked record in LandView or WellView Allez.
Built-In Queries
Create visual queries to filter leases, wells, or obligations by location or status directly from Peloton applications.
3D Visualization
Explore directional well paths and formations in 3D. Early-stage functionality for use cases that benefit from subsurface perspective.
Layer Management
Turn data layers on or off, including Peloton records and external GIS sources—to tailor your view for planning or review.
Cloud Access
Log in from any browser, no local software needed. View and interact with maps from the field, the office, or on the move.
Save & Revisit Areas of Interest
Bookmark key map regions to quickly return to frequently analyzed assets, lease blocks, or project zones.
peloton-map

Peloton Platform

Peloton Map

Request a Demo

One Platform. Total Spatial Context.

Peloton Map is built to work as part of the Peloton Platform from the start. With seamless links to LandView, WellView Allez, SiteView Allez, and ProdView, teams can move between spatial and operational views without missing context. Whether pulling in Esri-based layers or overlaying regulatory boundaries, Peloton Map keeps your geospatial data aligned with the systems you rely on every day, no extra stitching required. 

Request a Demo
Peloton Platform Integration
Navigate between Peloton Map, LandView, WellView Allez, SiteView Allez, and ProdView with linked records.
Esri ArcGIS Compatible
Use existing GIS layers and templates to complement your internal views.
Layer Enrichment
Overlay jurisdictional or regulatory boundaries for improved planning and awareness.
User-Customized Views
Save areas of interest, control map layers, and build workflows around your data.

Looking for more info

Dig Deeper

Hide Info

Looking for less info

Client Testimonials
Integrating the failure and failure detail tables provided us with a foundation to drive our core workflows. We use the tables for almost everything related to field-level and well-level management."
Senior Production Tech
quote
Peloton puts more real-time R&D in their products than any other oil and gas software vendor out there, and I have used a lot of them."
Engineering Technician
quote
It was the easiest SaaS migration I’ve ever done. Less than a week. I was able to sleep at night. These guys are the partner I should have gone with from the start for every part of my business.”
D&C Manager
quote

EXPLORE LAND DATA MANAGEMENT

Request A Demo

Part of

LAND DATA MANAGEMENT

land-icon-1 LandView
LandView Go
Multiple reports, schematics, and timetracks (or any combination) appear side by side. Think of it as your single well dashboard.
land-icon-2 Peloton

Map
Peloton

Map
Go
Multiple reports, schematics, and timetracks (or any combination) appear side by side. Think of it as your single well dashboard.
broker-icon-1 Peloton

Broker
Peloton

Broker
Go
Multiple reports, schematics, and timetracks (or any combination) appear side by side. Think of it as your single well dashboard.