Field Data Capture
Smartphone, tablet or laptop? Use all three for an easy-to-use solution that empowers your staff to collect, schedule, analyze, and monitor production and operations’ data and events.
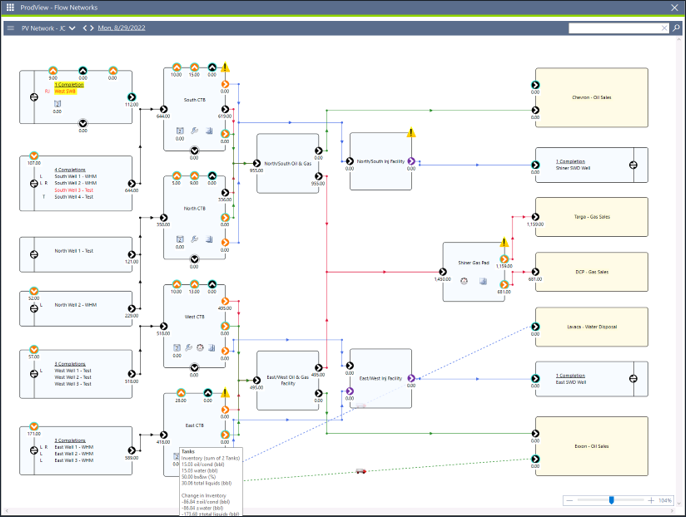
ProdView’s flow network diagram shows the physical flow of all products from the completion, through the gathering system to each disposition point. The diagram is interactive and will allow you to navigate to the source of the data for any run ticket, tank, meter, task or attachment. ProdView performs a mass balance at each unit in the gathering system and flags imbalances and other potential erroneous pieces of data as a visual data quality check.
The diagram is a date-effective visual representation of the allocation system, not a drawing that needs to be maintained. This process has proven to be an effective bridge in closing the communication gap between operations and accounting. Visualize the allocated production at a well level, or for each wells’ contribution to any point downstream of the wells themselves.

Smartphone, tablet or laptop? Use all three for an easy-to-use solution that empowers your staff to collect, schedule, analyze, and monitor production and operations’ data and events.
ProdView’s comprehensive list of regulatory reports ensures your reporting requirements are managed regardless of the governing body.
The Peloton Platform facilitates workflows between ProdView and all Peloton products. Manage your operations and engineering workflows within a single suite of applications.
ProdView is an interactive, visual production data management system providing reporting, graphing and mapping capabilities to assist in analyzing your operations.
Get the most out of your Peloton solutions with our well-executed services. Whether you’re in the midst of a new software implementation, or have used our software for the past 10 years, our team of technical experts will increase the value of your Peloton investment.
Check out the listing of all the upcoming Peloton Webinars on a wide variety of products! Topics range from intro knowledge of products to highly in-depth discussions centered around product-specific workflows.
The Peloton Operations Center provides direct access to your emissions and carbon tracking data to get a clear overview of your GHG data and report on that data to regulators.
Reach out to one of our twelve offices around the globe to access immediate support, to get information, or to speak with our international helpdesk.